Machine Learning

- The dataset consists of feature vectors belonging to 12,330 sessions. The dataset was formed so that each session would belong to a different user in a 1-year period to avoid any tendency to a specific campaign, special day, user profile, or period.
- Of the 12,330 sessions in the dataset, 84.5% (10,422) were negative class samples that did not end with shopping, and the rest (1908) were positive class samples ending with shopping.
- The dataset consists of 10 numerical and 8 categorical attributes. The 'Revenue' attribute can be used as the class label.
- Categories:
 439 Views
The dataset was specifically created to address the need for violence detection in surveillance systems. It consists of self-recorded videos simulating different types of violent activities relevant to college environments. The dataset is organized into four distinct classes:
Slap
Punch
Kick
Group Violence
Others - Over Crowding, Loitering, Assault, Abuse
Each video is labeled according to its corresponding class to facilitate supervised learning for violence detection models.
- Categories:
643 Views
All multimodal recommendation datasets used in the manuscript Enhancing Robustness and Generalization Capability for Multimodal Recommender Systems via Sharpness-Aware Minimization (BSAM), which includes five Amazon datasets. Each dataset includes both visual and textual modalities. Baby, Sports, Clothing, Pet, and Office from Amazon. All the datasets comprise textual and visual features in the form of item descriptions and images. Our data preprocessing methodology follows the approach outlined in the MMRec Framework.
- Categories:
16 Views
All multimodal recommendation datasets used in the manuscript Enhancing Robustness and Generalization Capability for Multimodal Recommender Systems via Sharpness-Aware Minimization (BSAM), which includes five Amazon datasets. Each dataset includes both visual and textual modalities. Baby, Sports, Clothing, Pet, and Office from Amazon. All the datasets comprise textual and visual features in the form of item descriptions and images. Our data preprocessing methodology follows the approach outlined in the MMRec Framework.
- Categories:
17 Views
The proper evaluation of food freshness is critical to ensure safety, quality along with customer satisfaction in the food industry. While numerous datasets exists for individual food items,a unified and comprehensive dataset which encompass diversified food categories remained as a significant gap in research. This research presented UC-FCD, a novel dataset designed to address this gap.
- Categories:
401 Views
Brain tumors are among the most severe and life-threatening conditions affecting both children and adults. They constitute approximately 85-90% of all primary Central Nervous System (CNS) tumors, with an estimated 11,700 new cases diagnosed annually. The 5-year survival rate for individuals with malignant brain or CNS tumors is alarmingly low, at 34% for men and 36% for women. Brain tumors are categorized into various types, including benign, malignant, and pituitary tumors.
- Categories:
593 Views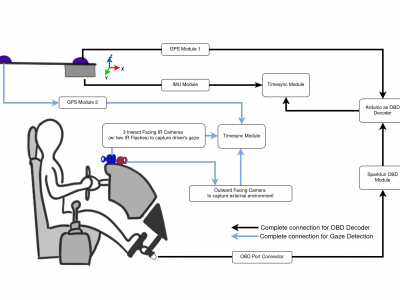
Repeated Route Naturalistic Driving Dataset (R2ND2) is a dual-perspective dataset for driver behavior analysis constituent of vehicular data collected using task-specific CAN decoding sensors using OBD port and external sensors, and (b) gaze-measurements collected using industry-standard multi-camera gaze calibration and collection system. Our experiment is designed to consider the variability associated with driving experience that depends on the time of day and provides valuable insights into the correlation of these additional metrics on driver behavior.
- Categories:
490 Views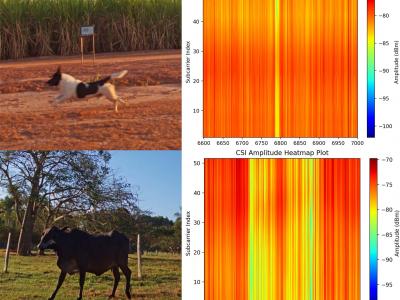
This dataset is shared as part of the paper Towards scalable and low-cost WiFi sensing: preventing animal-vehicle collisions on rural roads, submitted to the IEEE Internet of Things Journal (IoT-J). It contains Wi-Fi Channel State Information (CSI) data from roadway crossings of small and large animals, persons and vehicles in rural environments.
- Categories:
220 Views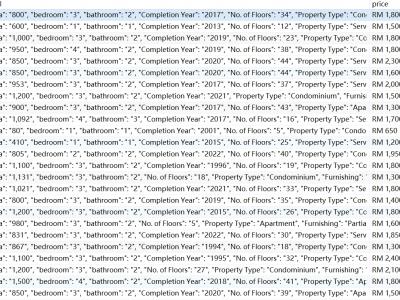
This dataset is the rent price for Kuala Lumpur and its neighborhood obtained from mudah.my in July 2024. The raw data is unprocessed and contains the original description of the house, the details in JSON format, the rent price, and the period.
This dataset is ideal for making rent price forecasts and exploring in depth what factors influence rent prices.
- Categories:
237 Views
BoardData is constructed from development board data provided by ST. These development boards are primarily utilized for function demonstration and platform development of STM32 series microcontrollers. They incorporate a suite of common sub-circuit modules for electronic devices, including interface modules, digital-to-analog and analog-to-digital converter modules, memory modules, comparators, touch modules, display modules, switch arrays, among others. Consequently, these boards exhibit a high degree of consistency with real PCB circuits.
- Categories:
44 Views