Transportation

Since 2018, our team has used coherent Doppler lidar to conduct extensive aircraft wake detection experiments at Chengdu Shuangliu International Airport and Mianyang Nanjiao Airport, and collected wake data of mainstream commercial aircraft including A320/A330/A350/B737/B747/B757/B767/B777/B787 under different meteorological conditions. These data include radial wind speed, spectral width Pitch, RadialWind (m/s), SpectralWidth, SpectralIntensity, etc.

Categories:

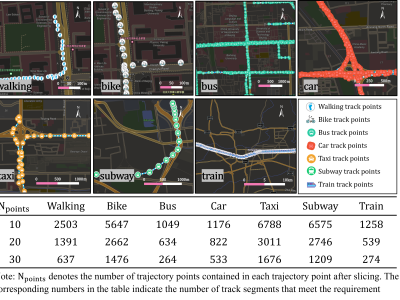
Transportation mode recognition has always been an important task in trajectory data mining. Trajectories are essentially sequences of trajectory points, so many studies have chosen sequence structures for modeling trajectories. However, sequence models cannot capture the higher-order structural features in trajectory. In this context, we propose a novel graph model Trajectory Feature Graph (TF-Graph) for capturing trajectory features. Core words are usually extracted to express the main meaning of a sentence in the field of Natural Language Processing.

Categories:

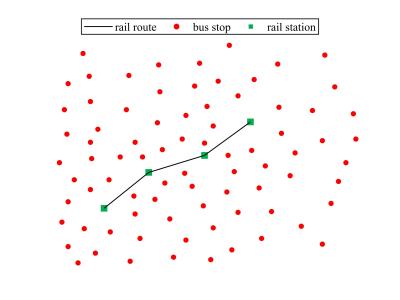
The dataset can be used to deal with the optimization design of feeder-bus network related to urban rail transit. The research on the optimization design of feeder-bus network related to urban rail transit is helpful to improve passengers' travel satisfaction and convenience, and solve the connection problem between rail transit station and bus stop. The dataset contains a 4 km by 5 km area, providing the coordinates of 80 bus stops and 4 rail transit stations.

Categories:

This dataset comprises ten adapted benchmark instances derived from the classical Prodhon dataset, along with one dataset based on a real-world logistics case study. The data are specifically designed to support the evaluation of a bi-objective Green Location Routing Problem (GLRP) model that aims to optimize both economic cost and environmental impact (carbon emissions). Each instance includes detailed information on depot locations and capacities, customer coordinates, demand values, time window settings, service durations, and depot fixed costs.

Categories:

The data is derived from 22,898 comments on driverless and human driving obtained by crawler technology on China's Weibo and XiaoHongshu platforms from May 1 to August 31, 2024. The main data formats are xlsx, py, txt, json and so on. The files in py format are script files, which are used to process data. The dataset was eventually used for topic mining, sentiment analysis, and more on Chinese users' comments on driverless and human driving.

Categories:

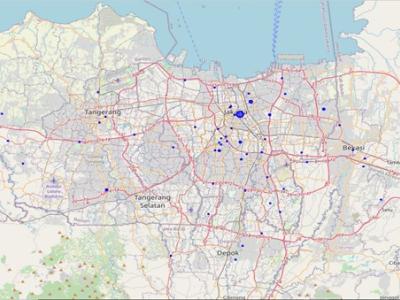
The dataset contains 56 rows and 51 columns, detailing various characteristics of EV charging stations (SPKLU) in the Jadetabek area. Key attributes include station identifiers, transaction metrics (e.g., number of transactions, unique users, average duration), geospatial data (latitude, longitude, easting, northing), administrative divisions, and location criteria. It also captures proximity to infrastructure such as roads, toll gates, and other EV stations, alongside charger counts for different types, population metrics, and income levels.

Categories:

The U.S. delay dataset is collected from Kaggle(https://www.kaggle.com/datasets/robikscube/flight-delay-dataset-20182022), covering three years of flight data from January 1, 2017, to December 31, 2019. The dataset originally collected includes data from 360 airports. We remove airports with fewer annual flight numbers and select data from 75 medium and large airports for our experiments.

Categories:

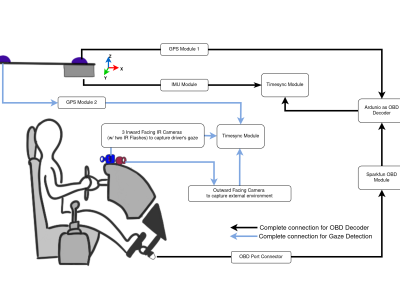
Repeated Route Naturalistic Driving Dataset (R2ND2) is a dual-perspective dataset for driver behavior analysis constituent of vehicular data collected using task-specific CAN decoding sensors using OBD port and external sensors, and (b) gaze-measurements collected using industry-standard multi-camera gaze calibration and collection system. Our experiment is designed to consider the variability associated with driving experience that depends on the time of day and provides valuable insights into the correlation of these additional metrics on driver behavior.

Categories:

The AIS dataset is provided by the National Oceanic and Atmospheric Administration (NOAA), spanning from January 2020 to December 2020. The trajectories of 140 individual vessels (including tankers and cargo) were collected. Weather and ocean conditions for the same period are obtained from the National Data Buoy Center (NDBC), collected from 15 buoys. 

Categories: