Signal Processing
YonseiStressImageDatabase is a database built for image-based stress recognition research. We designed an experimental scenario consisting of steps that cause or do not cause stress; Native Language Script Reading, Native Language Interview, Non-native Language Script Reading, Non-native Language Interview. And during the experiment, the subjects were photographed with Kinect v2. We cannot disclose the original image due to privacy issues, so we release feature maps obtained by passing through the network.
- Categories:
 3034 Views
This file is the related program and data of a deep interpolation convnet for bearing fault classification under complex conditions
- Categories:
 261 Views
Anxiety affects human capabilities and behavior as much as it affects productivity and quality of life. It can be considered as the main cause of depression and suicide. Anxious states are easily detectable by humans due to their acquired cognition, humans interpret the interlocutor’s tone of speech, gesture, facial expressions and recognize their mental state. There is a need for non-invasive reliable techniques that perform the complex task of anxiety detection.
- Categories:
 8907 Views
The ADAB database (The Arabic handwriting Data Base) was developed to advance the research and development of Arabic on-line handwritten systems. This database is developed in cooperation between the Institut fuer Nachrichtentechnik (IfN) and Research Groups in Intelligent Machines, University of Sfax, Tunisia. The text written is from 937 Tunisian town/village names. A pre-label assigned to each file consists of the postcode in a sequence of Numeric Character References, which stored in the UPX file format.
- Categories:
 2557 Views
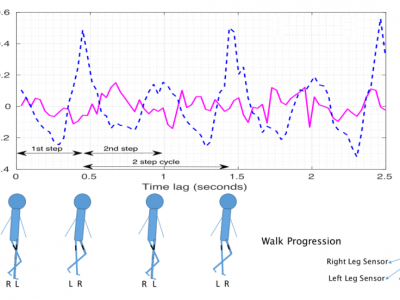
The PD-BioStampRC21 dataset provides data from a wearable sensor
accelerometry study conducted for studying activity, gait, tremor, and
other motor symptoms in individuals with Parkinson's disease (PD). In
addition to individuals with PD, the dataset also includes data for
controls that also went through the same study protocol as the PD
participants. Data were acquired using lightweight MC 10 BioStamp RC
sensors (MC 10 Inc, Lexington, MA), five of which were attached to
each participant for gathering data over a roughly two day
interval.
- Categories:
 9195 Views
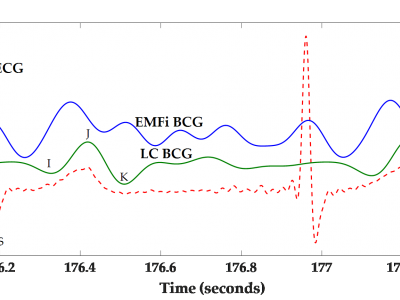
This open access webpage has all miscellaneous data and design related to ß-machines- Non-Medical, ß-Biomedical machines, processed ECG, sensors, heart and breathing patterns, sounds, finite element analysis, mathematics and BioEngineering.
As all only want free download and I used to get emails to share data freely ; with IEEE DataPort I had began journey of Data, so I will do update data as long as IEEE DataPort allows it or as long as I can or . I may also upload same data externally to other site.
- Categories:
 2499 Views
Falls are a major health problem with one in three people over the age of 65 falling each year, oftentimes causing hip fractures, disability, reduced mobility, hospitalization and death. A major limitation in fall detection algorithm development is an absence of real-world falls data. Fall detection algorithms are typically trained on simulated fall data that contain a well-balanced number of examples of falls and activities of daily living. However, real-world falls occur infrequently, making them difficult to capture and causing severe data imbalance.
- Categories:
 1088 Views
This dataset is in support of my following Research papers
Preprint (Make sure you have read Caution) :
- Novel ß Transtibial Prosthetic 9-DoF Artificial Leg Adaptive Controller - Part I*
- Categories:
 2107 Views


