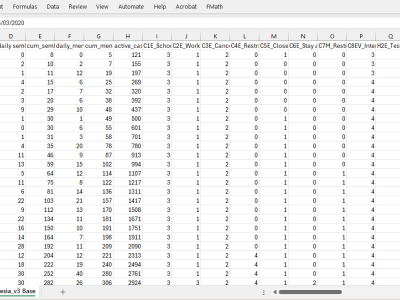
The dataset contains the data on ICU-transferred (N=100) and Stable (N=131) patients with COVID-19 (N=156) and Non-COVID-19 viral pneumonia (N=75). Among COVID-19 patients of this study, 82 patients developed Refractory Respiratory Failure (RRF) or Severe Acute Respiratory Distress Syndrome (SARDS) and were transferred to Intensive Care Unit (ICU), 74 patients had a Stable course of disease and were not transferred to ICU.
- Categories:

This repository contains:
- age-stratified Covid-19 case and fatality data for different countries and at different points in time, and
- an interactive Jupyter notebook for mediation analysis of age-related causal effects on case fatality rates,
published as part of the following paper:
"Simpson's paradox in Covid-19 case fatality rates: a mediation analysis of age-related causal effects". J von Kügelgen*, L Gresele*, B Schölkopf. (*equal contribution). https://arxiv.org/abs/2005.07180
We provide the following three separate datasets:
- a dataset containing only the most recent numbers from: Argentina, China, Colombia, Italy, Netherlands, Portugal, South Africa, Spain, Sweden, Switzerland, South Korea and the Diamond Princess cruise ship (last checked: end of May 2020)
- a longitudinal dataset containing several reports from Italy (9 March - 26 May 2020)
- a longitudinal dataset containing several reports from Spain (22 March - 29 May 2020)
All numbers of confirmed cases and fatalities are stratified by age into groups of 10 years (0-9, 10-19, 20-29, 30-39, 40-49, 50-59, 60-69, 70-79, 80+), and contain the date and country of reporting, as well as links to the corresponding sources (generally health agenices/ministries, or scientific publications).
Please consult the paper and notebook for further details.
- Categories:
This India-specific COVID-19 tweets dataset has been developed using the large-scale Coronavirus (COVID-19) Tweets Dataset, which currently contains more than 700 million COVID-19 specific English language tweets. This dataset contains tweets originating from India during the first week of each four phases of nationwide lockdowns initiated by the Government of India.
The zipped files contain .db (SQLite database) files. Each .db file has a table 'geo'. To hydrate the IDs you can import the .db file as a pandas dataframe and then export it to .CSV or .TXT for hydration. For more details on hydrating the IDs, please visit the primary dataset page.
conn = sqlite3.connect('/path/to/the/db/file')
c = conn.cursor()
data = pd.read_sql("SELECT tweet_id FROM geo", conn)
- Categories:
This dataset gives a cursory glimpse at the overall sentiment trend of the public discourse regarding the COVID-19 pandemic on Twitter. The live scatter plot of this dataset is available as The Overall Trend block at https://live.rlamsal.com.np. The trend graph reveals multiple peaks and drops that need further analysis. The n-grams during those peaks and drops can prove beneficial for better understanding the discourse.
The TXT files in this dataset can be used in generating the trend graph. The peaks and drops in the trend graph can be made more meaningful by computing n-grams for those periods. To compute the n-grams, the tweet IDs of the Coronavirus (COVID-19) Tweets Dataset should be hydrated to form a tweets corpus.
Pseudo-code for generating similar trend dataset
current = int(time.time()*1000) #we receive the timestamp in ms from twitter
off = 600*1000 #we're looking for 10-minute (600 seconds) average data (offset)
past = current - off #getting timestamp of 10-minute past the current time
df = select recent most 60,000 #even if we receive 100 tweets per second, the no. of tweets do not cross this number in an interval of 10 minutes
new_df = df[df.unix > past] #here "unix" is the timestamp column name in the primary tweets dataset
avg_sentiment = new_df["sentiment"].mean() #calculate mean
store current, avg_sentiment into a database
Pseudo-code for extracting top 100 "unigrams" and "bigrams" from a tweets corpus
import nltk
from collections import Counter
#loading a tweet corpus
with open ("/path/to/the/tweets/corpus", "r", encoding="UTF-8") as myfile:
data=myfile.read().replace('\n', ' ')
data = preprocess your data (use regular expression-perform find and replace operations)
data = data.split(' ')
stopwords = nltk.corpus.stopwords.words('english')
clean_data=[]
#removing stopwords from each tweet
for w in data:
if w not in stopwords:
clean_data.append(w)
#extracting top 100 n-grams
unigram = Counter(clean_data)
unigram_top = unigram.most_common(100)
bigram = Counter(zip(clean_data, clean_data[1:]))
bigram_top = bigram.most_common(100)
- Categories:
The dataset links to the survey performed on students and professors of Biological Engineering introductory course, as the Department of Biological Engineering, University of the Republic, Uruguay.
The dataset is meant for pure academic and non-commerical use.
For queries, please consult the corresponding author (Parag Chatterjee, paragc@ieee.org).
- Categories:
Urban informatics and social geographic computing, spatial and temporal big data processing and spatial measurement, map service and natural language processing.
- Categories:

This dataset has the following data about the COVID-19 pandemic in the State of Maranhão, Brazil:
- Number of daily cases
- Number of daily deaths
In addition, this dataset also contains data from Google Trends on some subjects related to the pandemic, related to searches carried out in the State of Maranhão.
The data follows a timeline that begins on March 20, 2020, the date of the first case of COVID-19 in the State of Maranhão, until July 9, 2020.
- Categories:

The last decade faced a number of pandemics [1]. The current outbreak of COVID is creating havoc globally. The daily incidences of COVID-2019 from 11th January 2020 to 9th May 2020 were collected from the official COVID dashboard of world health organization (WHO) [2] , i.e. https://covid19.who.int/explorer. The data is updated with the population of the countries and further Case fatality rate, Basic Attack Rate (BAR) and Household Secondary Attack Rate (HSAR) are computed for all the countries.
The data will be used by epidemiologist, statisticians, data scientists for assessing the risk of the Covid 2019 globally and would be used as a model to predict the case fatality rate along with the possible spread of the disease along with its attack rate.Data was in raw format. A detailed analysis is carried out from Epidemiology point of view and a datasheet is prepared through the identification of the Risk Factor in a Defined Population.The daily incidences of COVID-2019 from 11th January 2020 to 9th May 2020 were collected form the official covid dashboard of world health organization (WHO), i.e. https://covid19.who.int/explorer. The data is compiled in Excel 2016 and a database is created. The database is updated with the population of the countries and Case fatality rate, Basic Attack Rate (BAR) and Household Secondary Attack Rate (HSAR) is computed for all the countries.
- Categories: