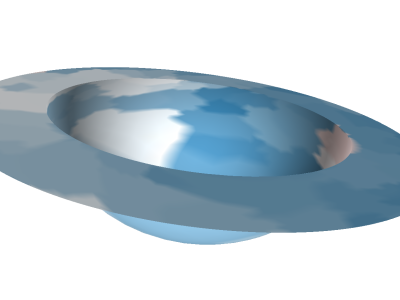
This dataset presents results of the Molecular Sombrero method, which simplifies protein cavities into an abstract, hat-like shape.
- Categories:
This dataset presents results of the Molecular Sombrero method, which simplifies protein cavities into an abstract, hat-like shape.

This dataset provides a labeled fake news data, which can be used to have a deep study of fake news.
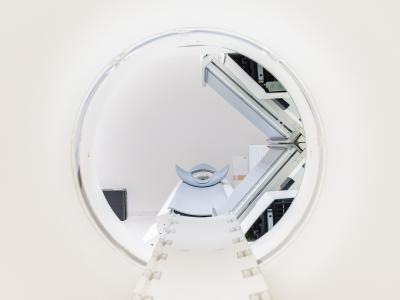
The dataset contains 208 patient scans that spread over three parts of anatomy(head, neck, and pelvis). The dataset aims to establish accurate anatomical correspondences between MegaVoltage Planar Digital Radio-graphs (MV-DRs) andKiloVoltage Digital Reconstructed Radiographs (KV-DRRs), which are widely used in Image-Guided Radiation Therapy (IGRT) to verify patients’ positions for accurate radiotherapy delivery.

3D-videos database.
The data set is composed of 2,285 definitions gathered from the Urban Dictionary platform from 1999 to 2006. The data was classified as misogynistic and non- misogynistic by three independent researchers with domain knowledge. The data set is available in public repository in a table containing two columns: the text-based definition from Urban Dictionary and its respective classification (1 for misogynistic and 0 for non- misogynistic).
Content warning: sexual violence, extreme misogyny, scatology, ‘scat porn’
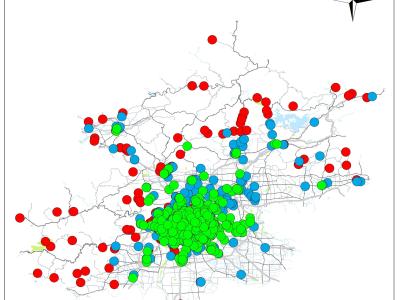
The data conclude two parts, i.e. shapefiles and excel files. The latter collected POI information of Beijing about the geographical coordinates, rating and other related description fields up to Aug 2017.

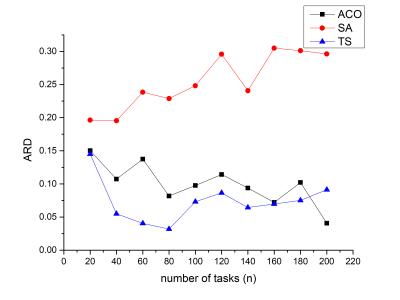
Ranking units which include multiple inputs and outputs in natural and social systems is a complex problem. DEA cross-efficiency evaluation method is an effective approach widely used in evaluating and ranking the decision making units to tackle this problem. The traditional cross-efficiency model is lack consideration for the relationships among DMUs. For this problem, the paper constructs the relationship matrix among DMUs to reflect the relationships among DMUs based on competitive interval and competitive vision.

Appendix for Principal Components
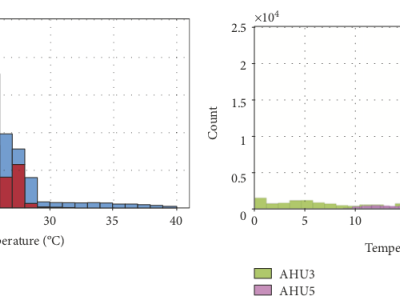
The dataset contains measurements taken from four air handling units (AHU) installed in a medium-to-large size academic building. The building is a 7-story, 9000 sqm facility commissioned in 2016 hosting the PRECIS research center. It contains multiple research laboratories, multifunction spaces, meeting rooms, and a large auditorium as well as administrative offices. It is located at 44°2606.0N and 26°0244.0E in a temperate continental climate with hot summers and cold winters. Cooling is handled using on-site electric chillers while heating is provided from a district heating network.

This material is associated with the PhD Thesis of Javier Olias (which is supervised by Sergio Cruces) and the article:
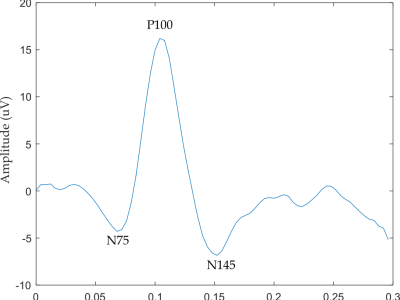
This dataset contains post-processed Pattern Reversal Visual Evoked Potential (PR-VEP) signals from 20 subjects, 12 males and 8 females between 24-28 years old. These signals are acquired with two different kinds of instruments: a new prototype based on Smart Glasses and a commercial device for PR-VEP.
For a detailed description of this dataset see accompanying publication "Pattern-Reversal Visual Evoked Potential on Smart Glasses" by Terracciano R., et al. IEEE Journal of Biomedical and Health Informatics 2019, 10.1109/JBHI.2019.2899774.
The presented dataset has been used as a basis for CAO - a system for analysis of emoticons in Japanese online communication, developed by Ptaszynski et al. (2010). Emoticons are strings of symbols widely used in text-based online communication to convey user emotions. The database contains: 1) a predetermined raw emoticon database containing over ten thousand emoticon samples extracted from the Web, 2) emoticon parts automatically divided from raw emoticons into semantic areas representing “mouths” or “eyes”.
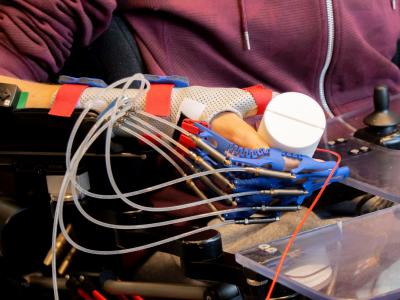
The dataset, includes raw data, observations and biometric data from our case study with an individual with DMD, controlling for the first time an active hand orthosis.
when iter time =50 ,we can obtain this picture

1. Figure S1 shows the plasma frequency profile of the two-layer analytical model of the ionosphere, see Eq. (9) of the main text.
This study investigated possible long-term cardiotoxicity-related left-ventricular (LV) contractile dysfunction in breast cancer patients who had treatment with anti-neoplastic chemotherapy agents (CTA). An automated cardiac contractility analysis tool consisting of quantization-based boundary detection and meshfree Radial Point Interpolation Method-based numerical analysis measured torsion and 3D strains for comparisons to healthy subjects to investigate LV remodeling otherwise not indicated by LV ejection fraction (LVEF).

In robotic grasping and manipulation, force feedback is one of the most important factors. In the absence of force feedback, force control and compliant grasping is almost impossible. In this study a novel Vibrational Haptic feedback system is designed. The system gives individual digit awareness of a multipronged robotic gripper to the user. It also gives force level feedback from each fingertip and simultaneous multiple force level feedback, all through one wearable elastic “Vibrational Haptic Band (Vi-HaB)”.
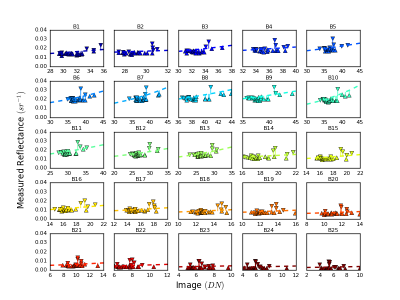
Empirical line methods (ELM) are frequently used to correct images from aerial remote sensing. Remote sensing of aquatic environments captures only a small amount of energy because the water absorbs much of it. The small signal response of the water is proportionally smaller when compared to the other land surface targets.
This dataset presents some resources and results of a new approach to calibrate empirical lines combining reference calibration panels with water samples. We optimize the method using python algorithms until reaches the best result.
These data are the natural language software product descriptions from softpedia. They have bee used for the research of software feature extraction and recommendation.
These data are the natural language software product descriptions from softpedia. They have bee used for the research of software feature extraction and recommendation.
These data are the natural language software product descriptions from softpedia. They have bee used for the research of software feature extraction and recommendation.
These data are the natural language software product descriptions from softpedia. They have bee used for the research of software feature extraction and recommendation.
These data are the natural language software product descriptions from softpedia. They have bee used for the research of software feature extraction and recommendation.

The PS-InSAR analysis method is a technique that utilizes persistent scatter in SAR images and performs image analysis by interfering with 25 or more slave images in a master image. Determining the accuracy of the above algorithm is the denser between images, the higher the coherence, the more accurate the image is. Therefore, the Minimum Spanning Tree (MST) algorithm is used to find the optimum coherence by considering the temporal, spatial, and coherence of each image rather than Star graph, which interferes with the rest of the slave images in one master image.