Graph Classification based on Trajectory Feature Graph and Self-attention Mechanism for Transportation Mode Recognition
- Citation Author(s):
-
kuan yang
- Submitted by:
- Rui Xin
- Last updated:
- DOI:
- 10.21227/trj1-mn07
 71 views
- Categories:
- Keywords:
Abstract
Transportation mode recognition has always been an important task in trajectory data mining. Trajectories are essentially sequences of trajectory points, so many studies have chosen sequence structures for modeling trajectories. However, sequence models cannot capture the higher-order structural features in trajectory. In this context, we propose a novel graph model Trajectory Feature Graph (TF-Graph) for capturing trajectory features. Core words are usually extracted to express the main meaning of a sentence in the field of Natural Language Processing. Inspired by this, we define different types of nodes and edges in the TF-Graph. Combined with the multidimensional properties designed for nodes and edges, both the structural information and semantic information can be taken into account. Furthermore, we process the transportation mode recognition as a graph classification task. A feature encoding method incorporating the self-attention mechanism is used in the graph embedding. Finally, we conducted classification experiments using the trajectory dataset from the Microsoft Geo-Life project, focusing on seven transportation modes: walking, bike, bus, car, taxi, subway, and train. The classification average accuracy reached 84.29%. In addition, comparing with other transportation mode recognition methods, it is found that our method has higher classification accuracy and more prominent feature extraction ability.
Instructions:
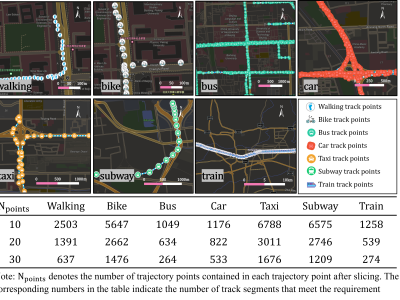
The GPS trajectory data used in this paper comes from Microsoft's Geo-Life project which is used in a large number of related works and is the baseline data for transportation mode recognition. Specifically, each trajectory point contains information such as latitude, longitude, elevation, and timestamp. The 69 users in the data recorded their transportation modes as walking, bike, bus, car, taxi, subway, train, plane, boat, and motorbike. The amount of trajectory data of boat, running, plane, and motorbike is too small resulting in a serious imbalance in the amount of data. Therefore, we chose seven modes of transportation from them that have enough data to be recognized to validate the methodology of this paper, which include walking, bike, bus, car, taxi, subway, and train.
Since there are inevitably some abnormal latitude, longitude, and velocity values, or discontinuous and uneven sampling points during data collection, it is necessary to clean the data before use. The sampling intervals of most trajectory points in the data are very concentrated. We first deleted the duplicate and abnormal points in the data and resampled the data to avoid redundancy, and the sampling intervals of the trajectory points after resampling are about 10-15s. In addition, we checked whether the average speed of the trajectory segments and the instantaneous speeds of the trajectory points were in line with reality, and deleted the trajectory segments that were mislabeled by the user, such as having excessive speed or trajectories on the railway are marked as walking. After the above processing, we obtained a trajectory dataset with higher data quality, and some sample data are shown in Fig. 7.


