Transportation
X-CANIDS Dataset (In-Vehicle Signal Dataset)
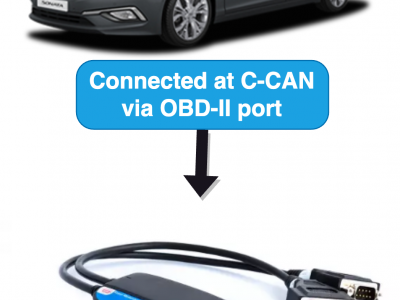
In March 2024, one of our recent research "X-CANIDS: Signal-Aware Explainable Intrusion Detection System for Controller Area Network-Based In-Vehicle Network" was published in IEEE Transactions on Vehicular Technology. Here we publish the dataset used in the article. We hope our dataset facilitates further research using deserialized signals as well as raw CAN messages.
Real-world data collection. Our benign driving dataset is unique in that it has been collected from real-world environments.
- Categories:
 2129 Views
PEMS03, PEMS04, PEMS07 and PEMS08, these four datasets are constructed from four areas in California. All the data was collected from the Caltrans Performance Measurement System (PeMS) and the spatial adjacency matrices for each dataset were built using a distance-based real road network. PEMS03 has 358 sensors with a duration of 3 months. PEMS04 has 307 sensors with a duration of 2 months. PEMS07 has 883 sensors with a duration of 3 months. PEMS08 has 170 sensors with a duration of 2 months.
- Categories:
1113 Views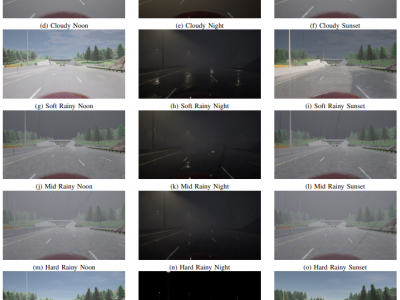
Safety of the Intended Functionality (SOTIF) addresses sensor performance limitations and deep learning-based object detection insufficiencies to ensure the intended functionality of Automated Driving Systems (ADS). This paper presents a methodology examining the adaptability and performance evaluation of the 3D object detection methods on a LiDAR point cloud dataset generated by simulating a SOTIF-related Use Case.
- Categories:
100 Views
- Categories:
848 Views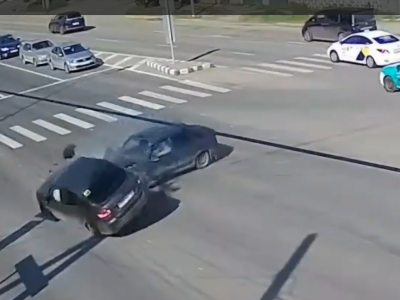
We introduce a novel dataset consisting of approximately 5,700 video files, specifically designed to enhance the development of real-time traffic accident detection systems in smart city environments. It encompasses a diverse range of traffic scenarios, captured through Traffic/Surveillance Cameras (Trafficam) and Dash Cameras (Dashcam), along with additional external data sources. The dataset is meticulously organized into three segments: Training, Validation, and Testing, with each segment offering a unique blend of traffic and dashcam footage across different scenarios.
- Categories:
7752 Views
The dataset contains ttwo columns, the first column represent the 'Time' data , while the second column represents the 'Current' data's. These figures are from a simulation of the 750 VDC traction system. These figures also show the train's high beginning current and used to study the DC traction system.
- Categories:
29 Views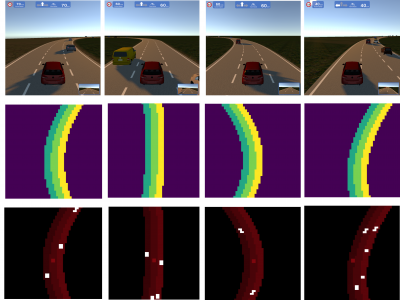
Volkswagen Group of America Innovation and Engineering Center California (VW IECC) is a research facility in Belmont, California working on the future of the mobility. In the recent years exciting developments have happened for the autonomous vehicles. In general, lack of data is the main problem to tackle to solve the task of autonomous driving. One of the important tasks in this topic is the overtaking and lane changes, especially in the highway scenarios.
- Categories:
499 Views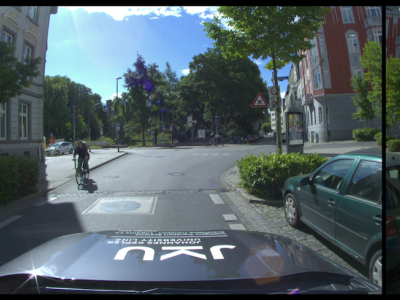
The IAMCV Dataset was acquired as part of the FWF Austrian Science Fund-funded Interaction of Autonomous and Manually-Controlled Vehicles project. It is primarily centred on inter-vehicle interactions and captures a wide range of road scenes in different locations across Germany, including roundabouts, intersections, and highways. These locations were carefully selected to encompass various traffic scenarios, representative of both urban and rural environments.
- Categories:
521 Views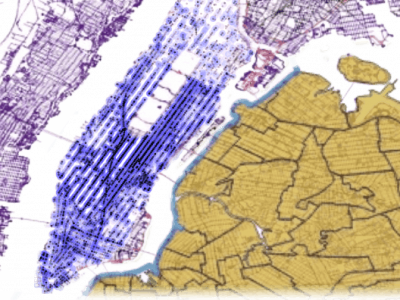
This dataset presents a set of large-scale Dial-a-Ride Problem (DARP) instances. The instances were created as a standardized set of ridesharing DARP problems for the purpose of benchmarking and comparing different solution methods.
The instances are based on real demand and realistic travel time data from 3 different US cities: Chicago, New York City, and Washington, DC. The instances consist of real travel requests from the selected period, positions of vehicles with their capacities, and realistic shortest travel times between all pairs of locations in each city.
- Categories:
195 Views
We have selected three intersections within Xi'an, Shaanxi Province, China for data collection. These include the intersection of Taibai South Road and Keji Road, the intersection of Chang'an North Road and Yanta West Road, and the intersection of Yanta North Road and Youyi Road. The UAV for the purpose of video data collection is employed to investigate intersections, with a high-definition video resolution of 4096 * 2160. The spatiotemporal position information of target vehicles was tracked and labeled using Datafromsky software.
- Categories:
346 Views