Remote Sensing

In this dataset, a human detecting model using with UWB radar technology is presented. Two distinct datasets were created using the UWB radar device, leveraging its dual features. Data collection involved two main scenarios, each containing multiple sub-scenarios. These sub-scenarios varied parameters like the position, distance, angle, and orientation of the human subject relative to the radar. Unlike conventional approaches that rely on signal processing or noise/background removal, this study uniquely emphasizes analyzing raw UWB radar data directly.
- Categories:
 678 Views
In this article, a novel method for interferometric target detection that employs coherent echoes and spatial frequency sampling is proposed. Originating from radio astronomy, interferometric passive microwave imaging has become widely applied for the passive microwave remote sensing of Earth. The proposed technique, termed Interferometric Coherent Echo Detection, is a novel active imaging method that capitalizes on coherent echoes to sample the spatial frequency domain.
- Categories:
25 Views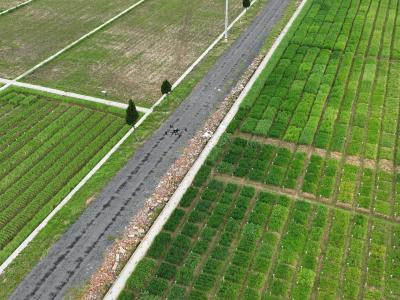
This is a wheat breeding phenotyping and yield dataset, including canopy height (CH, m), canopy volume (CV, m3), and leaf area index (LAI) collected in the field; vegetation index (VI) generated by multispectral data acquired by UAV remote sensing; trial site weather (Weather); and yield (Yield, kg). The data comes from field trials.
Data acquisition and processing are described in the relevant part of the manuscript.
- Categories:
325 Views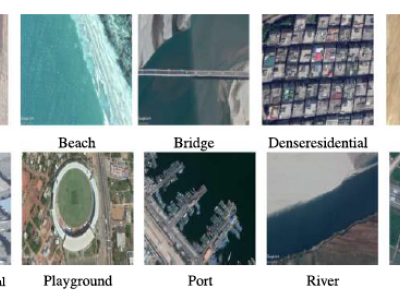
The Asian Subcontinent Dataset (ASCD) is a multisensor dataset that includes geospatial data collected from different countries within the Asian subcontinent, specifically India, Bangladesh, and Sri Lanka. The dataset consists of imagery captured through two main sources: Google Earth Pro software and IKONOS-2 satellite images. ASCD includes 14 distinct land cover classes, ranging from urban areas to natural environments, with 1,674 images. The number of images in each land cover class varies between 100 and 204.
- Categories:
143 Views
Accurate and spatiotemporal seamless soil moisture (SM) products are important for hydrological drought monitoring and agricultural water management. Currently, physically-based process models with data assimilation are widely used for global seamless SM generation, such as soil moisture active passive level 4 (SMAP L4), the land component of the fifth generation of European Reanalysis (ERA5-land) and Global Land Data Assimilation System Noah (GLDAS-Noah).
- Categories:
43 Views
The necessity for strong security measures to fend off cyberattacks has increased due to the growing use of Industrial Internet of Things (IIoT) technologies. This research introduces IoTForge Pro, a comprehensive security testbed designed to generate a diverse and extensive intrusion dataset for IIoT environments. The testbed simulates various IIoT scenarios, incorporating network topologies and communication protocols to create realistic attack vectors and normal traffic patterns.
- Categories:
363 Views
Optical remote sensing images, with their high spatial resolution and wide coverage, have emerged as invaluable tools for landslide analysis. Visual interpretation and manual delimitation of landslide areas in optical remote sensing images by human is labor intensive and inefficient. Automatic delimitation of landslide areas empowered by deep learning methods has drawn tremendous attention in recent years. Mask R-CNN and U-Net are the two most popular deep learning frameworks for image segmentation in computer vision.
- Categories:
223 Views
This dataset is from "One-Stage Cascade Refinement Networks for Infrared Small Target Detection." It includes 427 infrared images and 480 targets (due to the lack of infrared sequences, SIRST also contains infrared images at a wavelength of 950 nm, in addition to shortwave and midwave infrared images). Approximately 90% of the images contain only one target, while about 10% have multiple targets (which may be overlooked in sparse/significant methods due to global unique assumptions).
- Categories:
224 Views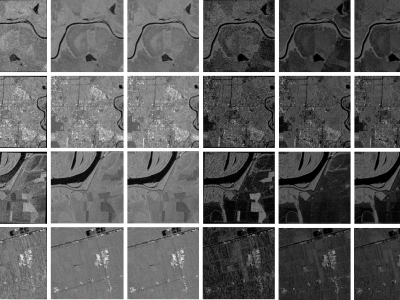
When training supervised deep learning models for despeckling SAR images, it is necessary to have a labeled dataset with pairs of images to be able to assess the quality of the filtering process. These pairs of images must be noisy and ground truth. The noisy images contain the speckle generated during the backscatter of the microwave signal, while the ground truth is generated through multitemporal fusion operations. In this paper, two operations are performed: mean and median.
- Categories:
761 Views
This archive is a .zip file of all of the data presented in the figures of the paper "Validation of a Long-Wavelength, Near-Field Scattering Simulator Based on Boundary Relaxation" along with a matlab m-file script to process and display the data. The simulation runs are also included in the .mat file format. VLF data are simultaneously sampled at 100 kHz with 16-bit resolution from 2 orthogonal magnetic loop antennas. Timing is provided by a GPS-trained oscillator.
- Categories:
77 Views