Geoscience and Remote Sensing

A direct three-dimensional (3-D) modeling of B-field in TDEM is proposed in the paper. We first introduce the forward modeling method of static magnetic field for the calculation of initial value of B-field. Then, we achieve the iterative calculation of B-field of magnetic media during the transient electromagnetic (TEM) stage by substituting the Cole–Cole susceptibility model into the B-field diffusion equation of double-curl induced magnetization intensity. The validity of this method is verified using several analytical solutions.
- Categories:
 48 Views
This compendium encompasses the entirety of hyperspectral data acquired across a spectrum of experimental scenarios (initially delineating the wavelength in the foremost column, followed by a sequential arrangement of every 10 columns demarcating a unique set of data under a specific condition, cumulatively spanning 51 columns), accompanied by an Excel spreadsheet detailing the electrical conductivity measurements of all mural plaster specimens.
- Categories:
31 Views
Research on the crustal structure of Princess Elizabeth Land (PEL) is of great importance for studying the composition and tectonic evolution of East Antarctica, and the structure and property feature given by gravity and magnetic anomalies is an effective way to analyze the subglacial crust structure. We collected digital elevation data, satellite gravity data and aeromagnetic data from PEL, and established the density and magnetic susceptibility structure of the crust in the study area through gravity and magnetic inversion methods.
- Categories:
1 Views
The raw MTBS data were downloaded from the official website (https://www.mtbs.gov/direct-download), and we select the pre-fire images, post-fire images, and thematic burn severity layers from 2010 to 2019 (over 7000 fires) across the conterminous United States as the data source of Landsat-BSA dataset. The raw MTBS dataset is preprocessed, reformed, and relabeled to produce the Landsat-BSA dataset with a sample size of 256 × 256.
- Categories:
558 Views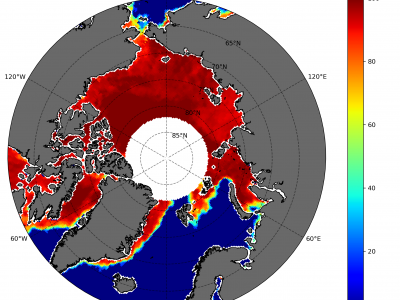
Sea ice concentration is important because it helps in determining important climate variables. Together with sea ice thickness, important fluxes between air and sea as well as heat transfer between the atmosphere can be determined. We designed an adapted bootstrap algorithm called SARAL/AltiKa Sea Ice Algorithm (SSIA) with some tunings and segregated the algorithm into winter and summer algorithms to estimate daily sea ice concentration (SIC) in the Arctic.
- Categories:
182 Views
SAR-optical remote sensing couples are widely exploited for their complementarity for land-cover and crops classifications, image registration, change detections and early warning systems. Nevertheless, most of these applications are performed on flat areas and cannot be generalized to mountainous regions. Indeed, steep slopes are disturbing the range sampling which causes strong distortions in radar acquisitions - namely, foreshortening, shadows and layovers.
- Categories:
388 Views

Learning SAR Dataset for Wet Snow Detection - Full Analysis Version.
- Categories:
298 Views
When considering urban growth in metropolitan areas, polycentric urban structures have been significantly observable everywhere, both in developing and developed nations. Morphological urban developments have been considered in many studies, and recently, attention has been paid to polycentric cities. Polycentricism is a collective concept that works at local, regional, and national levels. However, the development of polycentric urban spaces includes a multitude of decentralized morphologies and functional properties that have significant impacts.
- Categories:
29 Views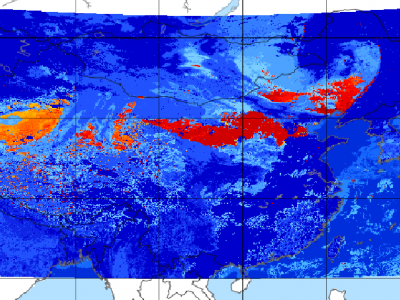
Since meteorological satellites can observe the Earth’s atmosphere from a spatial perspective at a large scale, in this paper, a dust storm database is constructed using multi-channel and dust label data from the Fengyun-4A (FY-4A) geosynchronous orbiting satellite, namely, the Large-Scale Dust Storm database based on Satellite Images and Meteorological Reanalysis data (LSDSSIMR), with a temporal resolution of 15 minutes and a spatial resolution of 4 km from March to May of each year during 2020–2022.
- Categories:
759 Views