Dataset Search

Displaying 721 - 744 of 8315 results

We consider the automation of polishing process for manufactured components, which is typically an iterative, multi-stage process that depends heavily on the practitioner’s expertise and visual inspection to guide decisions on polishing pad changes and fine-tuning of control parameters. We use a model-free, on-policy actor-critic reinforcement learning (RL) algorithm to determine the choice of pad, downforce, rotational speed, polishing duration for each stage, and the total number of polishing / inspection stages.

Categories:

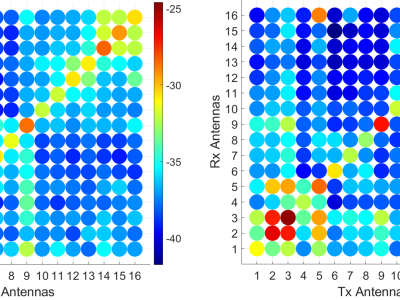
Spread spectrum time domain reflectometry (SSTDR) is proposed to replace the VNA or UWB pulsed systems and switches in a microwave imaging system. These tests evaluate an SSTDR system (Keysight N7081A) from 2-4 GHz. 16 ultrawideband (UWB) antennas were placed in contact with the breast phantom. The McGill breast phantom is a hemispherical carbon-based phantom with the electrical properties of fat. A cylindrical hole allows for the insertion of a plug with fat properties or fat+tumor properties. These were both measured and provided in the attached data set.

Categories:

This dataset accompanies the IEEE IoT Journal paper titled "A Dual System IoT Strategy for Hyperlocal Spatial-Temporal Microclimate Monitoring in Urban Environments Using LoRa." It is intended for validating bespoke sensors against commercial sensors. The data were collected using two different types of sensors deployed at eight locations in East London, starting on August 1, 2023, and covering a period of one year.

Categories:

Data was acquired using data aquisiton interface in a laboratory on a flow control unit. The data has been transformed into two excel spreadsheets which was later used in Matlab. This dataset also consists of three Matlab codes. First one is the code for the experiment in which the ANN models were developed. Second Matlab code is the code for data importing from the excel spreadsheets and the third Matlab code is the data preparation code for the Simulink purposes in order to test the models.

Categories:

Twelve (12) realistic datasets encapsulating residents’ preferences, with each dataset representing the appliance-usage preferences expressed for a variant set of households by their respective residents for a specific season and day. The preferences were extracted from the REFIT dataset, a public 500MB dataset which contains real kW readings of the power output for the most energy-intensive shiftable/real-time appliances in 20 households in the UK, between September 2013 and July 2015.

Categories:

The measurements in this study were carried out at Xidian University's north campus in China. The building density and height in this area are typical of urban environments, and there are fewer uncertainties that could affect the experimental results. Figure shows an aerial view of the measurement environment, including the chosen Tx and Rx locations. Centered at each receiver, a square with a side length 15 times the wavelength of the transmitted signal was constructed. The receiving antenna was moved inside each square following the path shown in the figure.


Categories:

Style Transfer Evaluation Benchmark (StyleBench) in submitted paper "StyleShot: A SnapShot on any Style".
To comprehensively evaluate the effectiveness and generalization ability of style transfer methods, we build StyleBench that covers 73 distinct styles, ranging from paintings, flat illustrations, 3D rendering to sculptures with varying materials. For each style, we collect 5-7 distinct images with variations. 
In total, our StyleBench contains 490 images across diverse styles.

Categories:

This dataset contains synthetic smart meter data with simulated cyber attacks, designed to support research in anomaly detection, cybersecurity, and energy consumption analysis. The dataset is based on 159 users from the Smart Meters in London dataset, selected for their regular consumption patterns. This larger dataset can be found in

https://www.kaggle.com/datasets/jeanmidev/smart-meters-in-london,

which is a refactorised version of the data found in

https://data.london.gov.uk/dataset/smartmeter-energy-use-data-in-london-households.

Categories:

During the study period, with the help of 292 participants, we were able to collect 599,635 app usage records. Here, we summarize the main characteristics of the participants based on the submitted surveys. 59% of the participants were female and 50% aged between 25 and 34. Participants were from all kinds of educational backgrounds ranging from high school diploma to PhD. In particular, 32% of them had a college degree, followed by 30% with a bachelor's degree. Smartphone was the main device used for connecting to the Internet for 53% of the participants, followed by laptop (25%).

Categories:

The Tsinghua App Usage Dataset is a large-scale mobile application usage dataset collected over one week in one of China’s largest cities. It contains anonymized app usage logs from 1,000 users, capturing detailed information on 2,000 identified apps across 9,800 base stations. Each record includes user ID, timestamp, base station location, app ID, and traffic consumption, allowing for comprehensive analysis of individual and regional mobile usage patterns.


Categories:

The dataset contains a revised version of the psychophysical color difference Munsell Re-renotation dataset.

Munsell Re-renotation is a psychophysical dataset describing large color differences, featuring 2986 colors characterized by standard colorimetric coordinates (x, y, Y) and coordinates within the Munsell system (H, V, C).The Munsell Re-renotation iteration enhances the uniformity of the system compared to its predecessor, the Munsell Renotation dataset.

Categories:

With the rapid advancement of large language models (LLMs), Model-as-a-Service (MaaS) has emerged as a powerful paradigm, enabling providers to deliver pre-trained models, computational resources, and database management within a unified platform.

Categories:

This dataset presents the captures of data packets in Wireshark for the scalability analysis of the Process Bus in Digital Substations based on the traffic of Sampled Values, through connection in redundant local area networks (LAN A and LAN B). LAN A is a 100 Mbps network that is saturated close to 10 Sampled Values suscriptions, while LAN B is a 1Gbps network that is not saturated and is used as a reference for the loss of data packets in each case. Emulated SV data is provided by software and a laboratory signal injector.

Categories:

The dataset comprises images generated using computational fluid dynamics (CFD) simulations for two cases: flow past an elliptic cylinder and flow past an aerofoil. Here are the details:

Elliptic Cylinder Dataset:

Images: 124 for low-speed and 124 for high-speed.
Conditions: Simulated for Reynolds numbers of 200 (low-speed) and 5000 (high-speed).

Aerofoil Dataset:

Images: 250 for low-speed and 250 for high-speed.
Conditions: Simulated under similar Reynolds number settings of 200 and 5000 for laminar and turbulent flows, respectively.

Categories:

Transformers, especially dry-type transformers, which nowadays are going to be employed instead of oil-type transformers, are one of the major equipment in the generation, transmission and distribution network of electric energy. The transformer insulation strength may reduce due to partial discharge (PD) occurrence, and this can finally result in its insulation failure.

Categories:

This data set is related to gas sensing, time-series classification. It has three columns: Time, I1, and Target. The Target column refers to the type of gas measured with the following classification:

•1 for Ammonia (NH₃)

•2 for Acetone (C₃H₆O) & Formaldehyde (CH₂O)

The data has been processed in a number of stages for accuracy and consistency. Raw data was first gathered using a Metal Oxide Semiconductor (MOS) sensor. After acquisition, the data were cleaned and processed, such as Savitzky-Golay filtering to remove noise or artifacts and smooth the signal.

Categories:

New technology solutions including tablets and advanced applications exist in modern classrooms across Indonesia but typically they miss the core educational objectives. The process of elementary school children memorizing the emoticon "happy" represents a lack of comprehension while high school students find themselves overwhelmed by IoT data and teachers work to adapt to AI-based educational requirements.

Categories:

The data for PVs and loads are sourced from “Multi-agent reinforcement learning for active voltage control on power distribution networks”, collected from Jan. 1 st, 2012 to Dec. 31 st, 2014 over a 3-minute interval. In this paper, the data is described as follows: 

Categories:

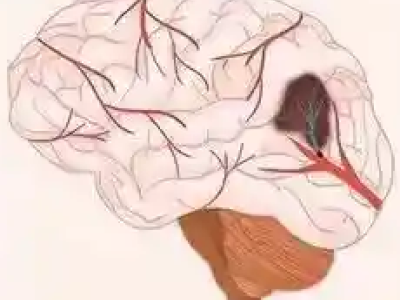
The Fuyong dataset records 134 stroke patients who received treatment in the Shenzhen Fuyong People's Hospital between March 1, 2022, and September 31, 2024. Besides, medical records of 435 stroke patients treated in the Affiliated Taizhou People's Hospital of Nanjing Medical University between January 1, 2020, and December 31, 2023, are included in the Taizhou dataset. These two datasets use the pre- and post-thrombolysis of the NIHSS scores as a metric for evaluating the immediate efficacy of the thrombolytic intervention.

Categories:

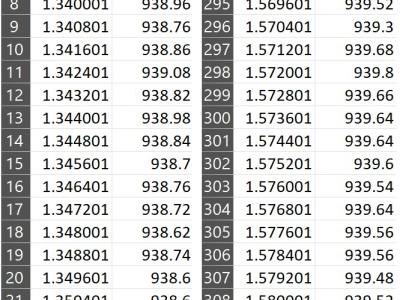
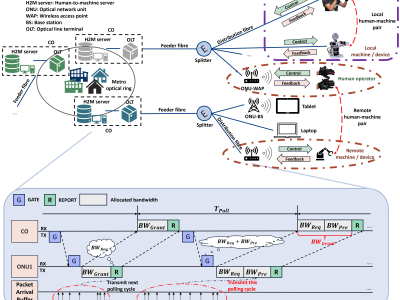
<p>The uploaded datasets contain packet arrival times from six distinct human-to-machine (H2M) applications for traffic modeling collected from a VR-based H2M experimental platform. The master device comprises VR gloves, each with two orientation sensors on the thumb and wrist (9-DOF) and five flexible sensors per finger for movement and force tracking. The sensors sample at 200 Hz, transmitting control signals via a customized Bluetooth interface (30 m range). Each control instance has 93 elements.

Categories:

The PlantVillage dataset, with over 54,000 images spanning 14 plant species and 26 disease types, has been widely used for leaf disease classification. However, it is limited in both scale and diversity. To address these limitations, we developed LeafNet, a large-scale dataset designed to support foundation models for leaf disease diagnosis. LeafNet comprises over 186,000 images from 22 crop species, covering 43 fungal diseases, 8 bacterial diseases, 2 mould (oomycete) diseases, 6 viral diseases, and 3 mite-induced diseases, categorized into 97 classes.

Categories:

Experimental Setup:

We conducted the experiment over two separate days. On the first day, the participants inspected the object Canva (Web version), while on the second day, they inspected the object Skoob (Web version). Our study had 31 participants (undergraduate students enrolled in the HCI - Human-Computer Interaction Course).

Categories: