Cryptococcus neoformans spontaneous Raman spectroscopy
- Citation Author(s):
-
Shuo Chen
- Submitted by:
- Shuo Chen
- Last updated:
- DOI:
- 10.21227/pgyn-y324
 102 views
- Categories:
- Keywords:
Abstract
This dataset is from our paper "Bridging Lab-to-Clinic: Microbiological Screening via Swin-Ultra Transformer with Transfer Learning", which aims to validate the extension of the lab-verified bacterial classification model to the gene-type screening of unseen pathogens in clinical settings.
The wild-type novel Cryptococcus neoformans strain H99 and 10 histone deacetylase (HDAC) mutants were cultured in a YPD medium. These HDAC mutants were generated by biotransformation of strain H99 and contain the following genes: DAC-1 (CNAG_04866), DAC-2 (CNAG_05563), DAC-3 (CNAG_00660), DAC-4 (CNAG_01563), DAC-5 (CNAG_05096), DAC-6 (CNAG_05276), DAC-7 (CNAG_07712), DAC-8 (CNAG_01699), DAC-9 (CNAG_02085), and DAC-10 (CNAG_06591). After overnight culture, the fungal samples were diluted in fresh YPD medium and incubated at 37°C for 6 hours. The mixture was then washed and centrifuged four times with phosphate-buffered saline (PBS) to remove the medium, and finally resuspended in 100 μL of PBS. Before Raman measurements, 1 μL of the fungal suspension was added to small wells on an aluminum substrate and covered with a quartz coverslip to prevent evaporation.
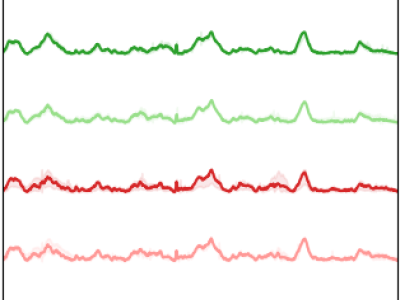
A confocal Raman microscope (Horiba JY HR Evolution, France) was used to measure 1021 spontaneous Raman spectra from the 11 strains (94, 104, 100, 100, 86, 90, 94, 84, 91, 95, and 83 spectra, respectively). A 785 nm diode laser (power approximately 19.2 mW) was used for excitation, with a 100x objective (NA = 0.90, Olympus) producing a laser spot of approximately 1 μm, allowing the excitation of a single fungal cell at a time. The wavenumber range was 200 cm-1 to 1800 cm-1, with a spectral resolution of 1 cm-1. Each Raman spectrum was collected with an exposure time of 20 seconds and accumulated 10 times.
Instructions:
1、The data set is in mat format.
2、Has been divided into training, validation, and test sets (stratified random sampling, 3:1:1)
3、Data can be loaded directly in matlab
4、Data can be read according to the following python script:
data = loadmat(r'./ c.at ')
wavenumbers = data['shift']
xtrain = data['xtrain']
ytrain = data['ytrain']
xval = data['xval']
yval = data['yval']
xtest = data['xtest']
ytest = data['ytest']
xtrain, xval, and xtest are the training, validation, and test sets, respectively.
ytrain, yval, and ytest are the corresponding labels respectively.