Datasets
Standard Dataset
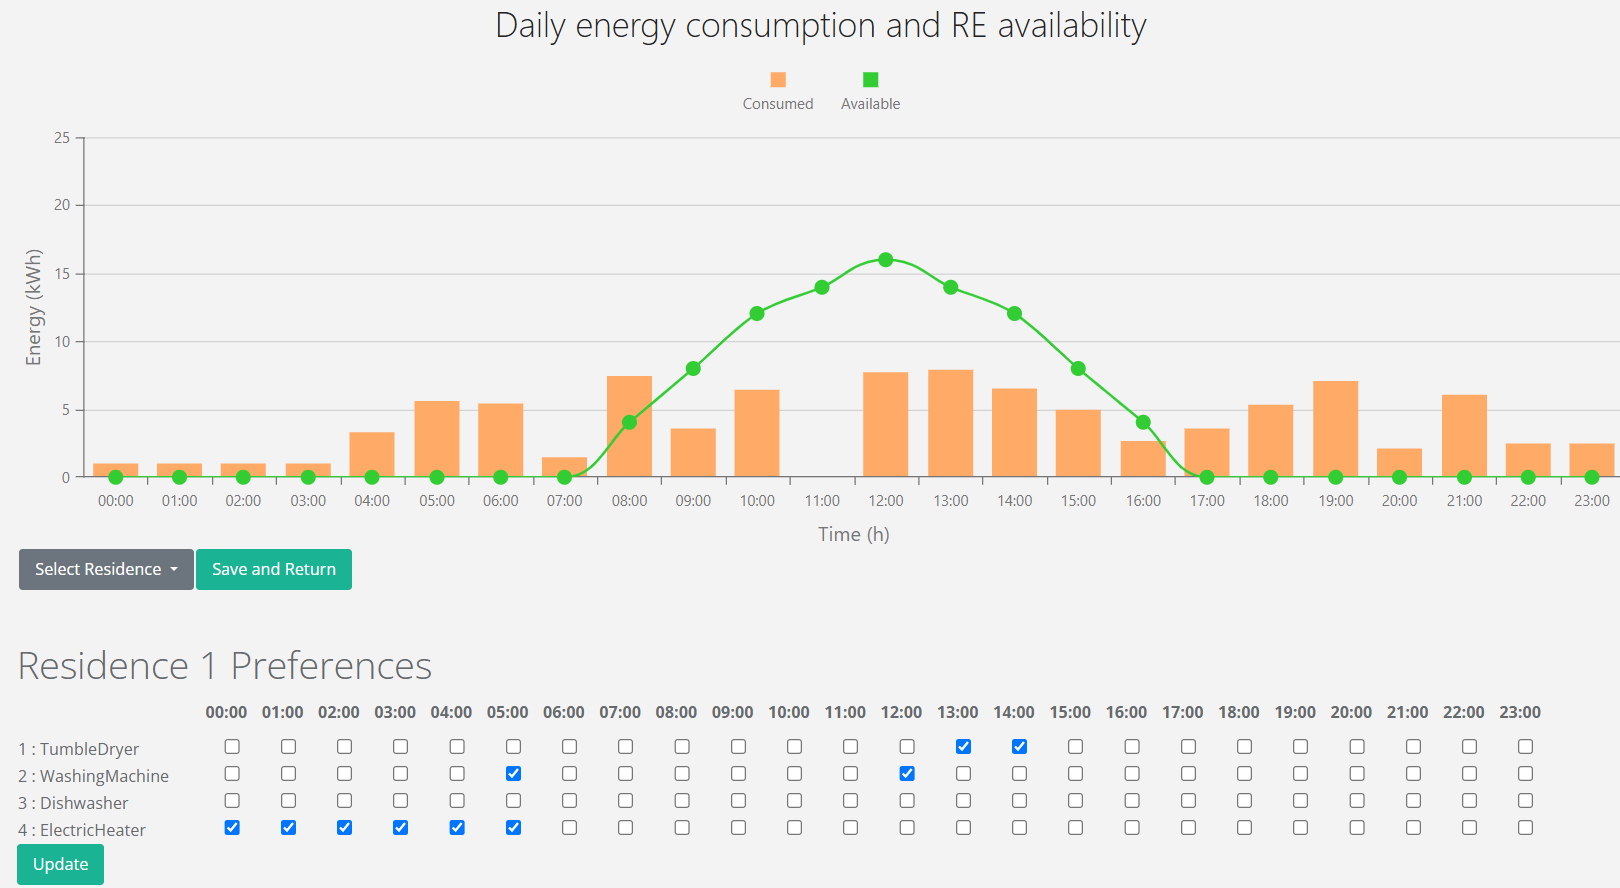
Household appliance-usage preferences, appliance energy consumption and hourly renewable-energy production, per season and date
- Citation Author(s):
-
ThalisPapakyriakou
 Frederick University
 - Submitted by:
- Thalis Papakyriakou
- Last updated:
- Mon, 02/24/2025 - 16:20
- DOI:
- 10.21227/jaaa-h321
- Data Format:
- Research Article Link:
- License:
 282 Views
- Categories:
- Keywords:
Abstract
Twelve (12) realistic datasets encapsulating residents’ preferences, with each dataset representing the appliance-usage preferences expressed for a variant set of households by their respective residents for a specific season and day. The preferences were extracted from the REFIT dataset, a public 500MB dataset which contains real kW readings of the power output for the most energy-intensive shiftable/real-time appliances in 20 households in the UK, between September 2013 and July 2015. The pre-processing performed in order to extract the preferences included (i) converting kW readings per second into perminute readings by removing duplicate records, (ii) converting per-minute readings into hourly readings by summing them up, (iii) defining preference (or not) of an appliance, per hour, through threshold values, and (iv) mapping each household to a resident and assigning the 24-hour preference-batch for a specific date for that household to the corresponding resident. Furthermore, the energy consumption per appliance was derived by examining the kW readings in the original dataset. The datasets that resulted from the above pre-processing can be found in the table below. Each dataset also includes renewable-energy production data, which is uniformly varied based on the number of households and season. A dataset’s hourly peak-production was defined as the output of a 4.5kW PV-system per household, using the standard formula for calculating solar panel energy production:
P_PV = P_peak ∗ (G / G_standard) − a ∗ (T − T_standard)
subject to (i) solar panels with P_peak = 450W and a temperature-coefficient a = 0.3, (ii) the Standard Test Conditions and (iii) the average seasonal temperature G and irradiance T in the UK:
Autumn: G : 9, T : 833
Winter: G : 5, T : 750
Spring: G : 13, T : 916
Summer: G : 17, T : 1000
Source: statista, 2024. UK: average temperature by month 2024 | Statista. LINK: https://www.statista.com/statistics/322658/monthly-average-daily-tempera...
Finally, a renewable-energy production curve is formed from 06:00 to 18:00 by assigning the peak-production value at 12:00 and adjusting the hourly production values according to the standard renewable-energy production curve, as often encountered.
| Dataset | Date | Num of residents (U) | Num of appliances (A) | Num of timeslots (T) | Households (IDs) | Demand (kWh) | Available Renewable energy (kWh) |
|---|---|---|---|---|---|---|---|
| Sml_Aut | 23/10/2013 | 5 | 25 | 24 | 1 2 3 4 5 | 113.4 | 114 |
| Sml_Win | 11/12/2013 | 5 | 25 | 24 | 1 3 4 5 6 | 96.2 | 92 |
| Sml_Spg | 05/04/2014 | 5 | 25 | 24 | 1 2 3 4 5 | 156.7 | 136 |
| Sml_Sum | 02/06/2014 | 5 | 25 | 24 | 1 2 3 4 5 | 97.5 | 162 |
| Med_Aut | 29/11/2013 | 10 | 49 | 24 | 1-10 (2*, 9*) | 183.6 | 228 |
| Med_Win | 19/01/2014 | 10 | 50 | 24 | 1 3 4 5 6 7 8 9 10 13 | 241.0 | 184 |
| Med_Spg | 18/03/2014 | 10 | 49 | 24 | 1-10 | 186.4 | 272 |
| Med_Sum | 15/06/2014 | 10 | 47 | 24 | 1 2 3 4 5 17-21 | 156.0 | 324 |
| Lrg_Aut | 23/10/2014 | 20 | 91 | 24 | 1-21 (all) | 248.9 | 456 |
| Lrg_Win | 25/01/2015 | 20 | 91 | 24 | 1-21 (all) | 418.7 | 368 |
| Lrg_Spg | 21/03/2014 | 20 | 91 | 24 | 1-21 (all) (4*, 11*) | 340.8 | 544 |
| Lrg_Sum | 28/06/2014 | 20 | 91 | 24 | 1-21 (all) | 302.1 | 648 |
*date unavailable, closest date retrieved
Each folder name signifies the number of residents (U) and the season,
for example, "5_AUT" means the autumn-dataset with 5 residents.
Within each folder are 4 files:
PARAMS VALUES
--------------
Line 1: num of appliances (A)
Line 2: num of timeslots (T)
Line 3: num of residents (U)
APP ENERGY
-------------
Every set of A vertical lines represents the energy consumption of each of those A appliances (in kWh) of a resident
There are a total of U such sets, one per resident u
APP PREFERENCES
-------------
Every 2D binary table (with zeros and ones) represents a single resident's / household's preferences.
There are a total of U such tables, one per resident u
Line index: timeslot t, total of T lines
Column index: appliance a, total of A columns
value in cell: 1 ==> preferred usage of appliance a at timeslot t by resident u
RENEWABLE
------------
Each line represents the renewable-energy production at that timeslot (in kWh)
There are a total of T such lines, one per timeslot t
Documentation
| Attachment | Size |
|---|---|
| 980 bytes |


Comments
.