Climate Change/Environmental

This data provides a comprehensive collection of air quality and meteorological data from several large cities in India. With 1,410 records, it includes key characteristics like the Air Quality Index (AQI) according to both U.S. and China standards, temperature, atmospheric pressure, humidity, wind speed, wind direction, and timestamps.

Categories:

How We Built This: Data, Tools, and Trust

We used official data from UNdata (last accessed November 2024), focusing on threatened species by country and year. The information was grouped into three main biodiversity categories—Vertebrates, Invertebrates, and Plants.

Using Python and Pandas, we cleaned and filtered the dataset to remove duplicates and non-country entries. For each year between 2004 and 2023, we highlighted the top 25 countries with the highest number of threatened species per category. This made the data easier to visualize and understand.

Categories:

Amid global climate change, rising atmospheric methane (CH4) concentrations significantly influence the climate system, contributing to temperature increases and atmospheric chemistry changes. Accurate monitoring of these concentrations is essential to support global methane emission reduction goals, such as those outlined in the Global Methane Pledge targeting a 30% reduction by 2030. Satellite remote sensing, offering high precision and extensive spatial coverage, has become a critical tool for measuring large-scale atmospheric methane concentrations.

Categories:

This dataset comprises 30 CSV files featuring text-based narratives developed as part of the MOVING (MOuntain Valorisation through INterconnectedness and Green Growth) Horizon 2020 project, which explores 454 value chains across 23 rural regions in 16 European countries. Additionally, it includes 30 JSON files that annotate the keywords within these narratives, linking them to their corresponding Wikidata entries and QIDs.

Categories:

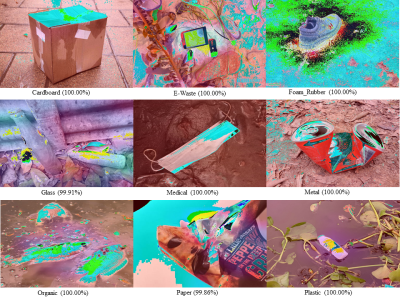
An automatic waste classification system embedded with higher accuracy and precision of convolution neural network (CNN) model can significantly the reduce manual labor involved in recycling. The ConvNeXt architecture has gained remarkable improvements in image recognition. A larger dataset, called TrashNeXt, comprising 23,625 images across nine categories has been introduced in this study by combining and thoroughly analyzing various pre-existing datasets.

Categories:


This dataset provides a comprehensive analysis of global land use and biodiversity trends, offering insights into how ecosystems are changing over time. It includes country-wise data on arable land, forests, and permanent crops, helping to track the impact of agriculture and deforestation on natural landscapes. The biodiversity section highlights protected areas and key conservation indicators, allowing researchers to assess the effectiveness of environmental policies.

Categories:

This dataset accompanies the IEEE IoT Journal paper titled "A Dual System IoT Strategy for Hyperlocal Spatial-Temporal Microclimate Monitoring in Urban Environments Using LoRa." It is intended for validating bespoke sensors against commercial sensors. The data were collected using two different types of sensors deployed at eight locations in East London, starting on August 1, 2023, and covering a period of one year.

Categories:

CO2 Emissions Data Visualization Project – I Hug Trees

The I Hug Trees CO2 emissions project is a data-driven initiative that visualizes global carbon footprints using interactive treemaps and bar charts. The dataset, sourced from UN Data, contains CO2 emissions figures for the top 25 highest-emitting countries, extracted from a larger global dataset. This structured CSV dataset categorizes emissions by country, industry, and energy source, enabling comparative analysis and trend identification.

Categories: