Image Fusion
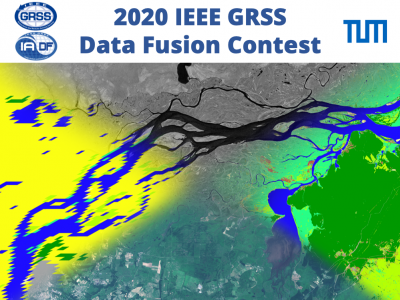
These last decades, Earth Observation brought quantities of new perspectives from geosciences to human activity monitoring. As more data became available, artificial intelligence techniques led to very successful results for understanding remote sensing data. Moreover, various acquisition techniques such as Synthetic Aperture Radar (SAR) can also be used for problems that could not be tackled only through optical images. This is the case for weather-related disasters such as floods or hurricanes, which are generally associated with large clouds cover.
- Categories:
 13494 Views
Depths to the various subsurface anomalies have been the primary interest in all the applications of magnetic methods of geophysical prospection. Depths to the subsurface geologic features of interest are more valuable and superior to all other properties in any correct subsurface geologic structural interpretations.
- Categories:
 472 Views
This is a collection of paired thermal and visible ear images. Images in this dataset were acquired in different illumination conditions ranging between 2 and 10700 lux. There are total 2200 images of which 1100 are thermal images while the other 1100 are their corresponding visible images. Images consisted of left and right ear images of 55 subjects. Images were capture in 5 illumination conditiond for every subjects. This dataset was developed for illumination invariant ear recognition study. In addition it can also be useful for thermal and visible image fusion research.
- Categories:
 637 Views
This is a dataset having paired thermal-visual images collected over 1.5 years from different locations in Chitrakoot, India and Prayagraj, India. The images can be broadly classified into greenery, urban, historical buildings and crowd data.
The crowd data was collected from the Maha Kumbh Mela 2019, Prayagraj, which is the largest religious fair in the world and is held every 6 years.
- Categories:
 3853 Views
The dataset contains high-resolution microscopy images and confocal spectra of semiconducting single-wall carbon nanotubes. Carbon nanotubes allow down-scaling of electronic components to the nano-scale. There is initial evidence from Monte Carlo simulations that microscopy images with high digital resolution show energy information in the Bessel wave pattern that is visible in these images. In this dataset, images from Silicon and InGaAs cameras, as well as spectra, give valuable insights into the spectroscopic properties of these single-photon emitters.
- Categories:
 726 Views
Multi-modal Exercises Dataset is a multi- sensor, multi-modal dataset, implemented to benchmark Human Activity Recognition(HAR) and Multi-modal Fusion algorithms. Collection of this dataset was inspired by the need for recognising and evaluating quality of exercise performance to support patients with Musculoskeletal Disorders(MSD).The MEx Dataset contains data from 25 people recorded with four sensors, 2 accelerometers, a pressure mat and a depth camera.
- Categories:
 1865 Views
- Categories:
 288 Views


