
This data file provides the MATLAB code to reconfigure the distribution networks using a fast and simple two-stage heuristic approach.
- Categories:
This data file provides the MATLAB code to reconfigure the distribution networks using a fast and simple two-stage heuristic approach.
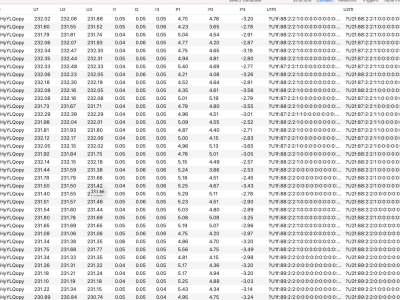
The dataset reflects a single household (home) power profile related to the grid. Households include typical appliances, two air-to-air heat pumps, a 3-phase 18 kW through-flow water heater, 6 kW solar panels and a 2,5 kW charger for the electric car.
For five-month (April_August) in 2022, every 0.2 sec took each 3-phase voltage and current measurement, calculate power and harmonics (up to 15th) for power profile registration.
Positive value reflects energy flow from the grid to a household, and negative values are energy flow to the grid.

The dataset provided contains the invariants in the form of antecedent and consequent mined using Association Rule Mining with implicit measures such as Confidence, Support, Lift, etc. from an EPIC Plant (Electrical Power and Intelligent Control System).

Accurate conversion loss models are the keys to guaranteeing the more efficient operation of networked hybrid AC/DC microgrids (N-AC/DC-MGs). A two-stage stochastic unit commitment (UC) problem is proposed to improve the operational efficiency of N-AC/DC-MGs under uncertain renewable energy generation output and loads. The nonlinear power losses of AC/DC converters and DC/DC converters under different operating modes are formulated as novel multivariate nonlinear functions of both power and voltage.
Algorithms that adjust the reactive power injection of converter-connected RES to minimize losses may compromise the converters’ fault-ride-through capability. This can become crucial for the reliable operation of the distribution grids, as they could lose valuable resources to support grid voltage at the time they need them the most. This paper explores how two novel loss-minimizing algorithms can both achieve high reduction of the system losses during normal operation and remain connected to support the voltage during faults.
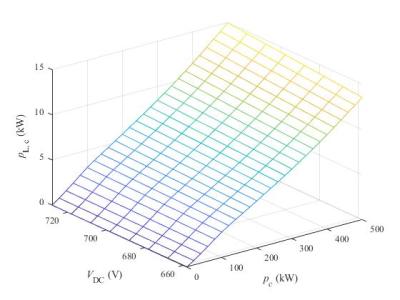
This dataset is created for neural network-based surrogate modeling of the power conversion losses. The dataset includes two sets of training and test data (for AC/DC and DC/DC converters respectively) for the neural network. The raw data is generated using PLECS Blockset Packages in MATLAB-Simulink environment.
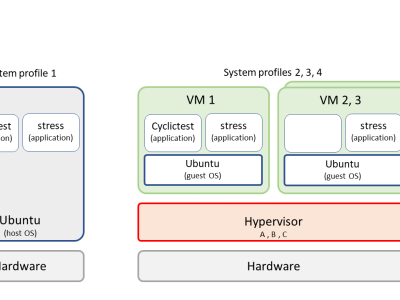
Emulating a RT task and measuring the response latency of its thread by means of the high-resolution testing tool Cyclictest. The thread was clocked at 10ms, and a FIFO scheduling policy was used, with the thread being assigned the highest priority. Measurements were performed in distinct testing environments, some of which had best effort concurrent threads competing for the machine resources. For this purpose, the workload generator tool stress was used.
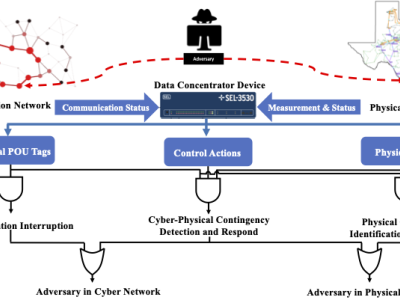
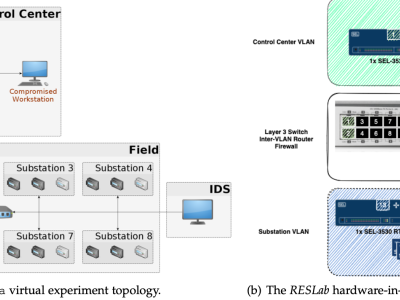
The dataset is generated by performing different Man-in-the-Middle (MiTM) attacks in the synthetic cyber-physical electric grid in RESLab Testbed at Texas AM University, US. The testbed consists of a real-time power system simulator (Powerworld Dynamic Studio), network emulator (CORE), Snort IDS, open DNP3 master, SEL real-time automation controller (RTAC), and Cisco Layer-3 switch. With different scenarios of MiTM attack, we implement a logic-based defense mechanism in RTAC and save the traffic data and related cyber alert data under the attack.
Port scanning attack is popular method to map a remote network or identify operating systems and applications. It allows the attackers to discover and exploit the vulnerabilities in the network.