Datasets
Standard Dataset
Single household power profile related to grid by every 0.2sec
- Citation Author(s):
- Submitted by:
- Peteris Apse-Apsitis
- Last updated:
- Sun, 02/05/2023 - 11:45
- DOI:
- 10.21227/rqzx-wt52
- Data Format:
- License:
 1339 Views
- Categories:
- Keywords:
Abstract
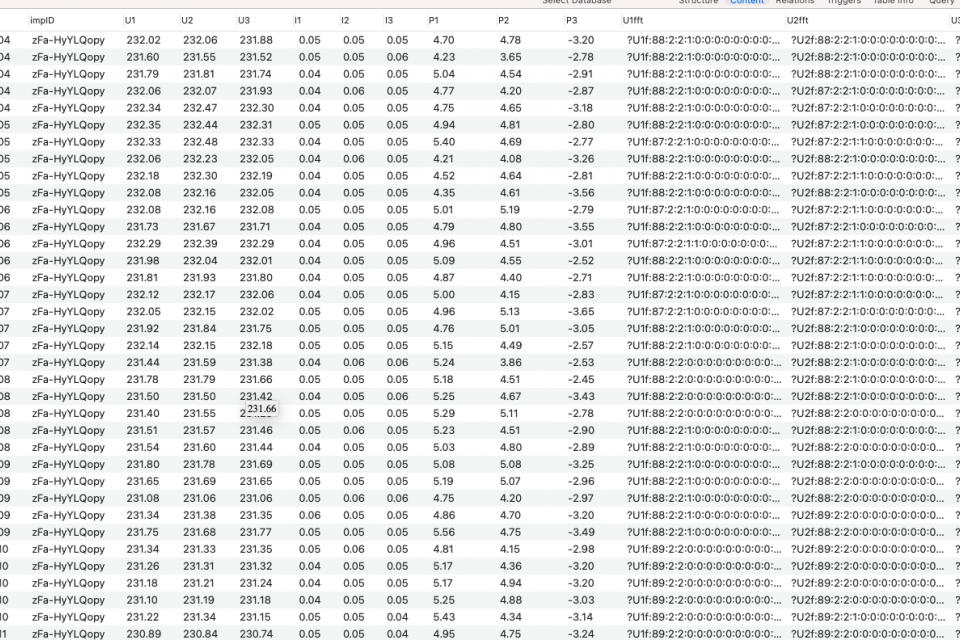
The dataset reflects a single household (home) power profile related to the grid. Households include typical appliances, two air-to-air heat pumps, a 3-phase 18 kW through-flow water heater, 6 kW solar panels and a 2,5 kW charger for the electric car.
For five-month (April_August) in 2022, every 0.2 sec took each 3-phase voltage and current measurement, calculate power and harmonics (up to 15th) for power profile registration.
Positive value reflects energy flow from the grid to a household, and negative values are energy flow to the grid.
One can observe graphs on the webpage https://remotelab.lv/power/powerD2.php (12 hours before chosen time) - U, I, P data.
Data graphs, including harmonics and THD, can be observed at https://remotelab.lv/power/powerD2_THD.php (1 hour before the selected time).
You can observe active power P data graphs at https://remotelab.lv/power/powerD2_P24h.php (24 hours period before chosen time).
One can zoom in on graphs, toggle lines, and charts can be synchronized.
Due to the tremendous data amount, here (file powerD2.sql) only shows the period from 15. Apr 2022 till 04. May 2022.
Get the SQL file powerD2.sql.The U, I, and P values for each phase are names as ...1, ...2, ... 3, for example, U1, U2, U3, and corresponding columns.Harmonics values U1fft, U2fft, U3fft, THD etc., are shown as each harmonic value as a percentage of the sum of all harmonic values.The file is large (3 GB), so it takes time to open and manipulate.


Comments
Research
...
.0