IoT
This dataset was created to develop and test firmware attestation techniques for embedded IoT swarms using Static Random Access Memory (SRAM). It contains sequential, synchronous SRAM traces collected from four-node and six-node IoT swarms of devices, each with a 2KB SRAM. Each device is loaded with "normal" or "tampered" firmware to create different network scenarios. Swarm-1 is a four-node network encompassing thirteen scenarios, including two normal network states, two physical twin states, and nine anomalous states.
- Categories:
 563 Views
Smart grid, an application of Internet of Things (IoT) is modern power grid that encompasses power and communication network from generation to utilization. Home Area Network (HAN), Field or Neighborhood Area Network (FAN/NAN) and Wide Area network (NAN) using Wireless LAN and Wireless/Wired WAN protocols are employed from generation to utilization . Advanced Metering Infrastructure, a utilization side infrastructure facilitates communication between smart meters and the server where energy efficient protocols are mandate to support smart grid.
- Categories:
418 Views
Smart grid, an application of Internet of Things (IoT) is modern power grid that encompasses power and communication network from generation to utilization. Home Area Network (HAN), Field or Neighborhood Area Network (FAN/NAN) and Wide Area network (NAN) using Wireless LAN and Wireless/Wired WAN protocols are employed from generation to utilization . Advanced Metering Infrastructure, a utilization side infrastructure facilitates communication between smart meters and the server where energy efficient protocols are mandate to support smart grid .
- Categories:
510 Views
The utilization of Wi-Fi-based technology for pervasive
indoor user identification has gained prominence due to its cost-
effective nature and compatibility with user devices. For identifying
unique users, previous works proposed capturing the media access
control (MAC) address of the signal emitted from a user’s device,
while information elements(IE)-based MAC de-randomization meth-
ods were presented to mitigate the impairment caused by random
MAC. However, the IE types of different Wi-Fi devices are not
- Categories:
176 Views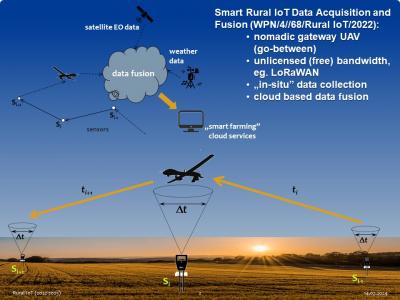
Measurement campaign was performed across the entire growing season of 2023. Seven Arduino+LoRaWAN sensors were measuring soil moisture, temperature and pH, as well as solar irradiance in the radius of about 35 km around Gdansk, Poland. Raw data were being collected with a nomadic gateway aboard an UAV and transferred to the cloud for analysis (package part A). Based on the physics informed analysis of the underlying measurement processes anomalies were classified and parametrized.
- Categories:
706 Views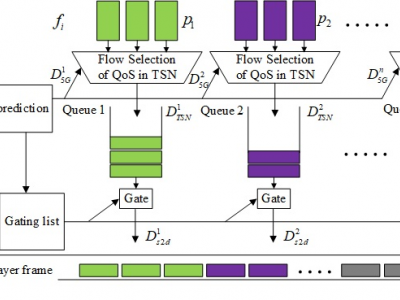
This dataset includes channel delay data for 5G and TSN networks.The 5G and TSN channel delay dataset includes a training set and a test set, with 600 sets of data in the training set and 200 sets of data in the test set, which are used for channel model prediction. The data in these datasets are real, collected in real-time from the running 5G-TSN system using network testers and data packet capture tools.
- Categories:
665 Views
To cover a large number of IoT use cases, we test our proposed framework against eight different application types with diverse task objectives, ranging from sensing to cryptography. For notational ease, the developed firmware are represented as Fi, with i = 1, 2, . . . , 8. The specific operations coded in these firmware are discussed below:
F1: A given input data block is first encrypted and then decrypted to retrieve the original data. The AES128 algorithm is used in this process and both encryption and decryption is performed in different functions, executed iteratively.
- Categories:
88 Views
This dataset is generated for the purpose of developing and testing attestation techniques for IoT devices. The dataset consists of RAM traces for eight different firmwares including traces for running the legitimate firmware as well as tampered versions of the firmwares. we upload the firmware onto the IoT device and allow it to operate for a predefined time period of 300 seconds. Throughout the device's normal operation, we utilize the gateway node to collect numerous RAM trace samples, each comprising 2048 bytes, with randomized intervals between consecutive samples.
- Categories:
173 Views
A dataset characterizing the parameters of a stepped piezoelectric cantilever beam using various geometric specifications is introduced. The dataset also shows the electric potential generated at each layer when exposed to a specific excitation frequency. The primary application of the cantilever is in ambient vibration energy harvesting, where the piezoelectric cantilever beam plays a crucial role in converting mechanical vibrations into electrical energy.
- Categories:
293 Views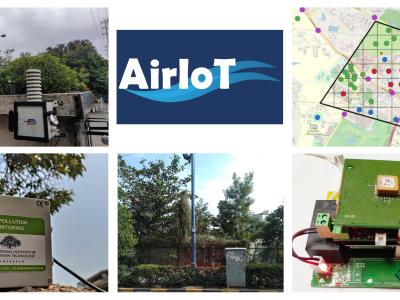
AirIoT is a temporal dataset of air pollution concentration values measured for almost three years in Hyderabad, India. In AirIoT, a dense network of IoT-based PM monitoring devices equipped with low-cost sensors was deployed. The research focuses on two primary aspects: measurement and modelling. The team developed, calibrated, and deployed 50 IoT-based PM monitoring devices throughout Hyderabad, India, covering urban, semi-urban, and green areas.
- Categories:
1364 Views