IoT
In our research, we generate datasets utilizing two key statistical models: the Poisson Process Distribution and the Beta Distribution. These models are employed to simulate and analyze various aspects of Quality of Service (QoS) in Internet of Things (IoT) environments, with a particular emphasis on wireless communications. By leveraging these distributions, our study aims to optimize resource allocation, improve reliability, and ensure that QoS requirements are met in complex and dynamic wireless communication scenarios within IoT ecosystems.
- Categories:
 289 Views
To assist individuals in sports activities is one of the emerging areas of wearable applications. Among various kinds of sports, detecting tennis strokes faces unique challenges. we propose an approach to detect three tennis strokes (backhand, forehand, serve) by utilizing a smartwatch. In our method, the smartwatch is part of a wireless network in which inertial data file is transferred to a laptop where data prepossessing and classification is performed. The data file contains acceleration and angular velocity data of the 3D accelerometer and gyroscope.
- Categories:
525 Views
Intrusion detection in Unmanned Aerial Vehicle (UAV) networks is crucial for maintaining the security and integrity of autonomous operations. However, the effectiveness of intrusion detection systems (IDS) is often compromised by the scarcity and imbalance of available datasets, which limits the ability to train accurate and reliable machine learning models. To address these challenges, we present the "CTGAN-Enhanced Dataset for UAV Network Intrusion Detection", a meticulously curated and augmented dataset designed to improve the performance of IDS in UAV environments.
- Categories:
1298 Views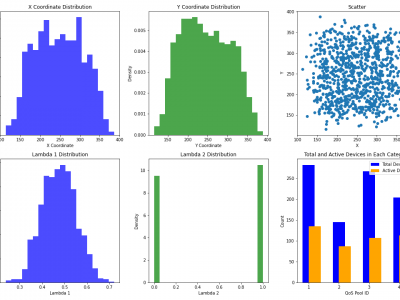
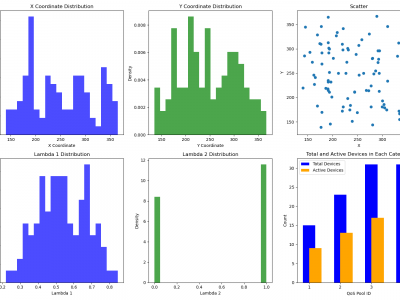
This dataset comprises a range of features, including time slots, device IDs, geographic coordinates (x, y), energy consumption, uplink history, emergency status, QoS pool identifiers, data flags, resource IDs, and data sizes. The device locations are modeled using a Poisson distribution with a spread of \(100\) meters within a \(500 \times 500\) meter area. The uplink history, QoS pool assignments, and data flags are derived from the probabilities of data availability and priority values.
- Categories:
362 Views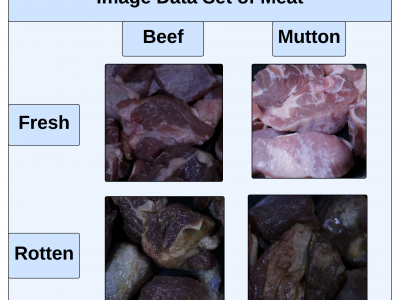
This paper presents an innovative Internet of Things (IoT) system that integrates gas sensors and a custom Convolutional Neural Network (CNN) to classify the freshness and species of beef and mutton in real time. The CNN, trained on 9,928 images, achieved 99% accuracy, outperforming models like ResNet-50, SVM, and KNN. The system uses three gas sensors (MQ135, MQ4, MQ136) to detect gases such as ammonia, methane, and hydrogen sulfide, which indicate meat spoilage.
- Categories:
599 Views
The TiHAN-V2X Dataset was collected in Hyderabad, India, across various Vehicle-to-Everything (V2X) communication types, including Vehicle-to-Vehicle (V2V), Vehicle-to-Infrastructure (V2I), Infrastructure-to-Vehicle (I2V), and Vehicle-to-Cloud (V2C). The dataset offers comprehensive data for evaluating communication performance under different environmental and road conditions, including urban, rural, and highway scenarios.
- Categories:
1196 Views
This is an IMU dataset of human arm motions.
Users wear a smart watch that is equipped with IMU sensors.
A VR controller is attached to a smart watch to provide orientation and location ground truth.
The orientation and location ground truth is accurately calibrated using techniques proposed in 'Real-time tracking of smartwatch orientation and location by multitask learning'.
This dataset contains magnetic distortion feature in many data traces, which means the magnetic field does not always point to the same direction (i.e., north) in global reference.
- Categories:
159 ViewsThe Unified Multimodal Network Intrusion Detection System (UM-NIDS) dataset is a comprehensive, standardized dataset that integrates network flow data, packet payload information, and contextual features, making it highly suitable for machine learning-based intrusion detection models. This dataset addresses key limitations in existing NIDS datasets, such as inconsistent feature sets and the lack of payload or time-window-based contextual features.
- Categories:
2283 Views
This dataset contains LoRa physical layer signals collected from 60 LoRa devices and six SDRs (PLUTO-SDR, USRP B200 mini, USRP B210, USRP N210, RTL-SDR). It is intended for use by researchers in the development of a federated RFFI system, whereby the signals collected from different receivers and locations can be employed for evaluation purposes.
More details can be found at https://github.com/gxhen/federatedRFFI
- Categories:
937 Views
This dataset mentioned in the article "Environment Independent Gait Recognition Based on Wi-Fi Signals". This dataset was collected using a pair of Wi-Fi transceivers gathering channel state information of human walking, with the transmitter featuring an omnidirectional antenna and the receiver having three omnidirectional antennas. Data was collected in four indoor environments, where eight users walked along 24 directions. For specific environments and directions arrangements, please refer to the article. Each user walked ten times in each direction.
- Categories:
81 Views