Machine Learning

We have prepared a synthetic dataset to detect and add new devices in DynO-IoT ontology. This dataset consists of 1250 samples and has 35 features, such as feature-of-interest, device, sensor, sensor output, deployment, accuracy, unit, observation, actuator, actuation, actuating range, tag, reader, writer, etc.
- Categories:
 357 Views
The dataset consists of training and test data and label matrices for single-pixel compressive DoA estimation for mmWave metasurface. The dataset will be uploaded soon. Currently, a small part of the dataset can be accessed through this repository. For detailed information, please visit Graph Attention Network Based Single-Pixel Compressive Direction of Arrival Estimation through https://arxiv.org/abs/2109.05466
- Categories:
 750 Views
In our study, datasets of two simulators, namely phasor-based simulator and hybrid-type simulator are used. In the hybrid environment, first, the outputs of the phasor-based simulator are converted to instantaneous waveforms, then based on instruction, distortions and noises are added (superimposed) to these waveforms, and finally, the distorted waveforms are fed to the detailed model of PMUs simulated in EMT domain. Outputs of both simulators can be found in the submitted file.
- Categories:
 715 Views
The availability of labelled Cyber Bulling Types dataset has been exhibited for high profile Natural Language Processing (NLP), which constantly leads the advancement of constructing and model creation-based text. I aim at extracting diverse and efficient Cyber Bully Tweets from the Twitter Social Media Platform. This dataset contains 5 types of cyber bullying samples. They are
1. Sexual Harassment
2. Doxing
3. Cyberstalking
- Categories:
 7355 Views
Aspect Sentiment Triplet Extraction (ASTE) is an Aspect-Based Sentiment Analysis subtask (ABSA). It aims to extract aspect-opinion pairs from a sentence and identify the sentiment polarity associated with them. For instance, given the sentence ``Large rooms and great breakfast", ASTE outputs the triplet T = {(rooms, large, positive), (breakfast, great, positive)}. Although several approaches to ASBA have recently been proposed, those for Portuguese have been mostly limited to extracting only aspects without addressing ASTE tasks.
- Categories:
 538 Views
The dataset contains the navigation measurements obtained in the indoor experiment field. The volunteers move on the whole 4th floor of the Building D of Dong Jiu Teaching classes at Huazhong University of Science and Technology. Meanwhile, the experimental area consists of a total area of 717 m 2. These datasets were used and can be used to test and validate the radio map database updating-based localization positioning algorithm through the RSSI signals space.
- Categories:
 1426 Views
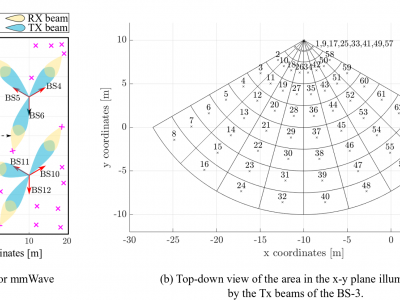
This dataset includes the measured Downlink (DL) signal-to-noise ratios (SNRs) at the User Equipments (UEs), adopting one of the beams of the beamforming codebook employed at the Base Stations (BSs). First, we configured a system-level simulator that implements the most recent Third Generation Partnership Project (3GPP) 3D Indoor channel models and the geometric blockage Model-B to simulate an indoor network deployment of BSs and UEs adopting Uniform Planar Arrays (UPAs) and a codebook based transmission.
- Categories:
 669 Views
This dataset consists of real paddy field images taken from various heights under variable natural lighting conditions. Also, this dataset consists of images with water and soil background removed and annotated images, representing different kinds of plants (paddy, weeds of paddy such as grass, broadleaved weed, sedges) in different color for groundtruth.
- Categories:
 4856 Views
Most of Facial Expression Recognition (FER) systems rely on machine learning approaches that require large databases (DBs) for an effective training. As these are not easily available, a good solution is to augment the DBs with appropriate techniques, which are typically based on either geometric transformation or deep learning based technologies (e.g., Generative Adversarial Networks (GANs)). Whereas the first category of techniques have been fairly adopted in the past, studies that use GAN-based techniques are limited for FER systems.
- Categories:
 2206 Views


