.csv

Accurate short-term load forecasting (STLF) plays an increasingly important role in reliable and economical power system operations. This dataset contains The University of Texas at Dallas (UTD) campus load data with 13 buildings, together with 20 weather and calendar features. The dataset spans from 01/01/2014 to 12/31/2015 with an hourly resolution. The dataset is beneficial to various research such as STLF.
- Categories:
 3449 Views

This dataset used in the experiment of paper "Bus Ridesharing Scheduling Problem". This is a real-world bus ridesharing scheduling problem of Chengdu city in China, which includes 10 depots, 2,000 trips.
- Categories:
374 Views
This is the dataset used in the experiment of paper "Bus Pooling: A Large-Scale Bus Ridesharing Service". The dataset contains 60,822,634 trajectory data from 11,922 Shanghai taxis from one day (Apr 1, 2018). The 100 groups of coordinate sets containing three coordinates as experimental samples are used to compare the effectiveness and efficiency of location-allocation algorithms.
- Categories:
833 Views
This dataset refers to the case study performed in the paper "A Real Options Market-Based Approach to Increase Penetration of Renewables", submitted to IEEE Transactions on Smart Grid. The file contains the Midcontinent ISO data used for the day-ahead prices, as well as the wind data from NREL's Wind Integration National Dataset Toolkit which was used to estimate the renewable productions in the case study.
- Categories:
307 Views
A new dataset named Sanitation is released to evaluate the HAR algorithm’s performance and benefit the researchers in this field, which collects seven types of daily work activity data from sanitation workers.We provide two .csv files, one is the raw dataset “sanitation.csv”, the other is the pre-processed features dataset which is suitable for machine learning based human activity recognition methods.
- Categories:
1062 Views
An emulator for the Viessmann Vitorond 200 Gas Fired Boiler VD2 Series 380 dataset was created in Matlab/Simulink based on the Simscape boiler model.
- Categories:
2987 Views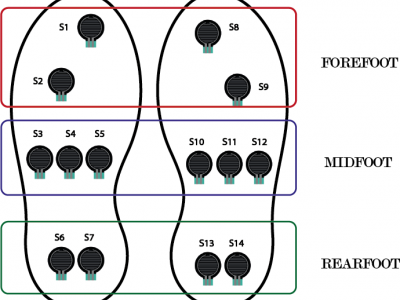
The pressure sensors are represented by black circles, which are located in the three zones of each foot. For the left foot: S1 and S2 cover the forefoot area. S3, S4, and S5 the midfoot area. S6 and S7 the rearfoot or heel area. Similarly, for the right foot: S8 and S9 represent the forefoot area. S10, S11, S12 the midfoot area. S13 and S14 the heel area. The values of each sensor are read by the analog inputs of an Arduino mega 2560.
- Categories:
1204 Views
A two-year electricity consumption data of a hotel building in Shanghai, China and and corresponding outdoor weather data.
- Categories:
1259 Views
The present dataset is based on implementing of 3 approaches with respect to the acquisition of driver data. The same one that we propose to use a sensor of concentration of alcohol in the environment (physiological), a sensor that measure the temperature of the defined points on driver’s face (biological) and another one that allows to identify and recognize the thickness of the pupil (visual characteristics).
- Categories:
3032 Views