Signal Processing

Data from acoustic condition monitoring of a milling process. During the process, several test parts were milled and acoustic data was recorded using a MEMS microphone.
One file shows two different tools used during milling, one for rough (face) milling with five cutting edges, and one with four cutting edges.
The other files show the data from different parts being milled, with the tool having four cutting edges. There were seven parts milled in total.
As the parts progress, it can be seen that the acoustic data changes, indicating wear and damage in the tool.
- Categories:
 47 Views
We introduce a dataset comprised of energy consumption data from smart meters in French households, capturing detailed, disaggregated time series for various home appliances. This dataset covers a six-month period with a one-minute sampling rate across five different households. The objective of this dataset is to support the development of models that learn disentangled representations of time series energy data, which can significantly enhance model generalization across both in-distribution and out-of-distribution scenarios.
- Categories:
 195 Views
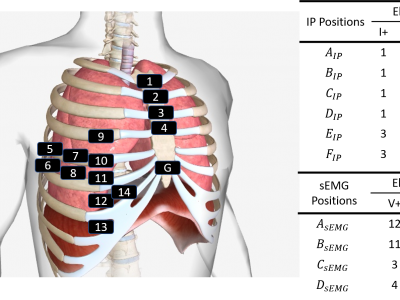
Objective: This study evaluates the feasibility of a noninvasive system for monitoring diaphragmatic efficiency in people with cervical spinal cord injury (CSCI). Methods: Two versions of a portable hardware system were developed using impedance pneumography (IP) to measure tidal volume (TV) and surface electromyography (sEMG) to assess diaphragm electrical activity (EAdi). Version 1 was used to determine optimal electrode positions, while Version 2 integrated these sensor systems into a compact, portable design.
- Categories:
 173 Views
This dataset contains audio recordings sourced from more than 57 TV shows provided by the Saudi Broadcasting Authority. The total number of hours published for these recordings is ~667 hours. The recordings are in Arabic, the majority are in Saudi dialects, and some are in other dialects. To enhance the usage of SADA, the dataset is split into training, validation, and testing sets. Each of validation and testing sets is around 10 hours in audio segments length while training set is 418 hours.
- Categories:
 135 Views
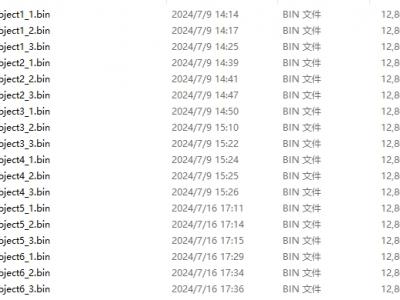
A total of 6 subjects participated in the experiment with each for three times test.We activated antennas for transmitting Tx0 and for receiving Rx1-4 to obtain the raw-data during experiment. Meanwhile, DCA1000EVM is transferring the raw-data to PC. According to parameters that had been set, each raw-data is 12,800 KB to be utilized.
- Categories:
 194 Views
Synthetic EEG Dataset for CNN Training: Clean and Artifact-Contaminated Signals
This dataset consists of synthetically generated EEG and EMG signals designed for training Convolutional Neural Networks (CNNs) in artifact detection and removal. The dataset includes both clean EEG signals and EEG signals contaminated with simulated EMG artifacts from various sources.
- Categories:
 254 Views
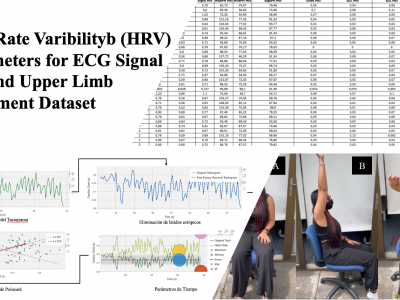
Heart Rate Variability (HRV) parameters provide valuable insights into the autonomic nervous system’s regulation of the cardiovascular system in response to various physiological conditions, particularly during dynamic tasks. This dataset consists of ECG recordings obtained during the execution of three dynamic tasks based on the three-dimensional movement of the upper limb. The data is available in both .XLSX and .CSV formats, containing 166 rows and 21 columns, all of which correspond to HRV parameters such as RR intervals, heart rate, and frequency-domain measures.
- Categories:
 357 Views
Introduced here is the Extended-Length Audio Dataset for Synthetic Voice Detection and Speaker Recognition (ELAD-SVDSR), a resource designed to advance research in synthetic voice (DeepFake) detection and automatic speaker recognition (ASR). It features around 45-minute audio recordings from 36 participants, each of whom read aloud different newspaper articles during controlled sessions, captured with five different high-quality microphones. Synthetic voices generated from 20 subjects of this dataset using open-source and commercial software are also included.
- Categories:
 115 Views
The Clarkson University Affective Data Set (CUADS) is a multi-modal affective dataset designed to assist in machine learning model development for automated emotion recognition. CUADS provides electrocardiogram, photoplethysmogram, and galvanic skin response data from 38 participants, captured under controlled conditions using Shimmer3 ECG and GSR sensors. ECG, GSR and PPG signals were recorded while each participant viewed and rated 20 affective movie clips. CUADS also provides big five personality traits for each participant.
- Categories:
 196 Views
This compressed file contains the original data (`.fig` files) of Figures 8 and 9 from the research on transforming noisy RF oscillators. These data are crucial for validating the phase noise reduction scheme of VCOs. They can provide in - depth insights into the impact of different LPF bandwidths and gains on phase noise, facilitating further research and verification in this field.
- Categories:
 41 Views


