Impedance Pneumography and Diaphragm Surface Electromyography

- Citation Author(s):
-
Jack Curley (San Diego State University)Esteban Gomez (San Diego State University)Laith Adnan (San Diego State University)Isabelle Ablao (San Diego State University)Jayden Sumbillo (San Diego State University)Henry York (VA San Diego)Hakan Töreyin
 (San Diego State University)
- Submitted by:
- Hakan Toreyin
- Last updated:
- DOI:
- 10.21227/wt3b-d228
 178 views
Abstract
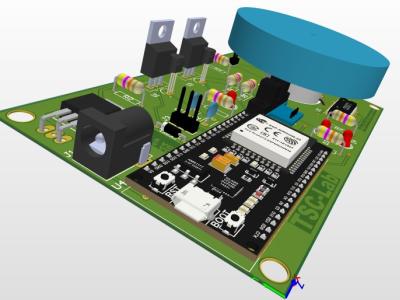
Objective: This study evaluates the feasibility of a noninvasive system for monitoring diaphragmatic efficiency in people with cervical spinal cord injury (CSCI). Methods: Two versions of a portable hardware system were developed using impedance pneumography (IP) to measure tidal volume (TV) and surface electromyography (sEMG) to assess diaphragm electrical activity (EAdi). Version 1 was used to determine optimal electrode positions, while Version 2 integrated these sensor systems into a compact, portable design. Data from eight healthy male participants were analyzed to assess the correlation and accuracy of TV and respiration rate (RR) prediction using IP and the correlation between sEMG signals and maximum inspiratory pressure (MIP). Results: For IP, measurements between the upper sternum and the midclavicular line (MCL) at the 4th intercostal (IC) space showed the highest correlation with true tidal volume. For sEMG, measurements between the mid-sternum and the 6th IC space demonstrated the strongest correlation with MIP. The integrated version 2 hardware demonstrates simultaneous IP and sEMG measurement while dissipating 2.17 mW. Discussion/Conclusion: The proposed system and the results presented can pave the way to a practical, cost-effective solution for continuous diaphragmatic efficiency monitoring, and thus enabling home-based respiratory care of CSCI patients.
Instructions:
Instructions
This dataset includes impedance pneumography (IP) and surface electromyography (sEMG) data, collected over two sessions across six IP positions and four sEMG electrode positions.
- Session 1 (IP Data Collection): IP measurements were recorded concurrently with a Biopac TSD117B flowmeter while subjects had their nostrils clipped. The session included a 60-second baseline, followed by 120 seconds of shallow and deep breathing, with 30-second rest breaks between each condition.
- Session 2 (sEMG Data Collection): sEMG was recorded at different breathing effort levels. Maximum inspiratory pressure (MIP) was measured using a K5 IMT device (POWERBreathe, UK) by having subjects inhale against a blocked airway. Participants then performed 30-second breathing exercises at intensities ranging from 10% to 60% MIP in 10% increments, with 30-second rest intervals. All measurements were repeated for each electrode position.
A. Impedance Pneumography (IP)
A.1. Dataset
- The dataset is stored in IP_AllSubjects.mat.
- It contains a cell-type matrix (aligned_cell_matrix) with the following structure:
- Column 1: Subject number
- Column 2: IP data
- Column 3: Flowmeter data
- Columns 2 and 3 contain data for all six IP positions (A–F).
A.2. MATLAB Script
- The MATLAB script for analyzing IP data is IP_Processing.m.
- Manual Inputs:
- Subject and position (Modify lines 13–14).
- Start and end time for data plotting (Modify lines 28–29).
- Processing Steps:
- The script plots all raw IP and flowmeter data.
- Flowmeter data is converted into cumulative inhalation volume.
- The processed IP and flowmeter data are plotted against time.
- The script calculates the true inhalation volume per breath (in liters) by computing the cumulative difference between integrated airflow (flowmeter) steps.
B. Surface Electromyography (sEMG)
B.1. Dataset
- The dataset is stored in sEMG_AllSubjects.mat.
- It contains raw sEMG data in an 8×4 cell array, corresponding to:
- 8 subjects (S1–S8)
- 4 electrode positions (A–D)
- The sampling rate is 1 kHz.
B.2. MATLAB Script
- The MATLAB script for analyzing sEMG data is sEMG_Processing.m
- This MATLAB script processes sEMG data from multiple subjects and conditions by:
- Loading the .mat file
- Filtering noise (bandpass filtering: 10–400 Hz, notch filters: 60, 120, 180, 240 Hz).
- Removing ECG artifacts using Singular Value Decomposition (SVD).
- The script uses Pan-Tompkins Algorithm to detect ECG R-waves. For that, it uses pan_tompkin(ecg,fs,gr) function in [PT-REF].
- Extracting key features:
- Root Mean Square (RMS) values
- Peak-to-Peak Voltage (Vpp)
- Calculating RMS and Vpp values over predefined MIP(%) time intervals.
- Visualizing raw and cleaned signals.
- Exporting processed results to a CSV file.
- Manual Inputs Required:
- Data directories (data_dir, source_dir) – specify where raw and processed files are stored.
- Subjects and electrode positions (subjects, conditions) – already set for the provided dataset.
- MIP(%) segment times (segment_times_all) – predefined in the script but can be adjusted if needed.
This script enables a comprehensive analysis of sEMG signals, ensuring proper noise filtering, artifact removal, and feature extraction for further research.
[PT-REF] Hooman Sedghamiz (2025). Complete Pan Tompkins Implementation ECG QRS detector (https://www.mathworks.com/matlabcentral/fileexchange/45840-complete-pan-tompkins-implementation-ecg-qrs-detector), MATLAB Central File Exchange. Retrieved February 9, 2025.


Typo fixed.