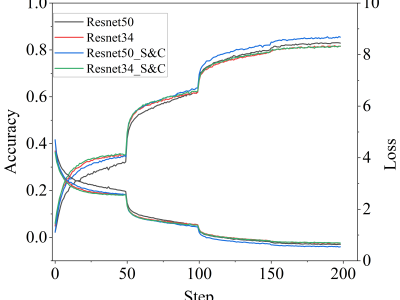
This figure shows the accuracy and loss curves generated during the training process. We trained different neural networks on the CIFAR-100 dataset. For each network, the same training strategy was applied to every image in the dataset. The blue curve represents the accuracy after replacing the convolution layers, which achieves a higher accuracy compared to other networks.In the figure, the green curve represents the network after replacing standard convolution with the SCT module. We can see that the red and green curves converge towards the end.
- Categories: