Artificial Intelligence

Most plant diseases have observable symptoms, and the widely used approach to detect plant leaf disease is by visually examining the affected plant leaves. A model which might carry out the feature extraction without any errors will process the classification task successfully.  The technology currently faces certain limitations such as a large parameter count, slow detection speed, and inadequate performance in detecting small dense spots. These factors restrict the practical applications of the technology in the field of agriculture.

Categories:

Blade damage inspection without stopping the normal operation of wind turbines has significant economic value. This study proposes an AI-based method AQUADA-Seg to segment the images of blades from complex backgrounds by fusing optical and thermal videos taken from normal operating wind turbines. The method follows an encoder-decoder architecture and uses both optical and thermal videos to overcome the challenges associated with field application.

Categories:

Sentiment analysis, which aims to identify the positive or negative tone of a given text, has seen a surge in interest over the past two decades, making it one of the most studied areas of study in the fields of Natural Language Processing and Information Extraction. Due to the ambiguous nature of sarcasm, however, sarcasm detection is an essential part of sentiment analysis. The task becomes exceedingly challenging when applied to a language with a more intricate morphology and a lack of available resources, such as Telugu.

Categories:

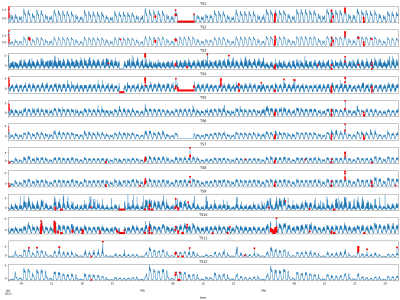
A recent study [1] alerts on the limitations of evaluating anomaly detection algorithms on popular time-series datasets such as Yahoo, Numenta, or NASA, among others. In particular, these datasets are noted to suffer from known flaws suchas trivial anomalies, unrealistic anomaly density, mislabeled ground truth, and run-to-failure bias. The TELCO dataset corresponds to twelve different time-series, with a temporal granularity of five minutes per sample, collected and manually labeled for a period of seven months between January 1 and July 31, 2021.

Categories:

The input data in this paper consisted of sMRI image data from the ADNI dataset (https://adni.loni.usc.edu/), including 98 scans from 30 AD subjects, 100 scans from 24 EMCI subjects, 105 scans from 25 LMCI subjects, and 107 scans from 26 NC subjects, for a total of 433 scans from 105 subjects, with roughly equal numbers of AD, EMCI, LMCI, and NC data. The basic information of the subject data showed in Table 4.It is important to note that the data we downloaded from the ADNI public dataset was in DICOM format, and we needed to convert it to NII format using SPM12.


Categories:

We generated an IV fluid-specific dataset to maximize the accuracy of the measurement. We developed our system as a smartphone application, utilizing the internal camera for the nurses or patients. Thus, users should be able to capture the surface of the fluid in the container by adjusting the smartphone's position or angle to reveal the front view of the container. Thus, we collected the front view of the IV fluid containers when generating the training dataset.

Categories:

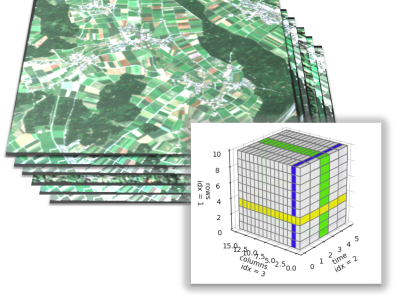
The  Sentinel-2 L2A multispectral data cubes include two regions of interest (roi1 and roi2) each of them containing 92 scenes across Switzerland within T32TLT, between 2018 and 2022, all band at 10m resolution These areas of interest show a diverse landscape, including regions covered by forests that have undergone changes, agriculture and urban areas.

Categories:

This data set contains four types of road images: asphalt roads and gravel roads; Wading roads and snowy roads. It is mainly used to train road recognition models. Due to the large amount of original data, this data set only contains a part of road images. If you feel it is useful for your research, please email (wangzhangu1@163.com) to get the complete data set.

Categories:

The dataset file contains all the relevant data for this paper, including original text data, labels, and statistical information, which is utilized for training, testing, and validation of the proposed models or arguments. Additionally, there is a question bank file that comprises all test questions, filtered test data, and annotated result data after testing. This data is used to evaluate the performance of the models or methods proposed in the paper.

Categories: