
Test synthetic population produced with WEKA 3.8.
- Categories:
Test synthetic population produced with WEKA 3.8.

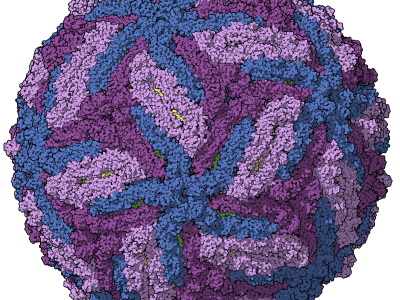
This dataset is a result of my research production into machine learning in android security. The data was obtained by a process that consisted to map a binary vector of permissions used for each application analyzed {1=used, 0=no used}. Moreover, the samples of malware/benign were devided by "Type"; 1 malware and 0 non-malware.
When I did my research, the datasets of malware and benign Android applications were not available, then I give to the community a part of my research results for the future works.

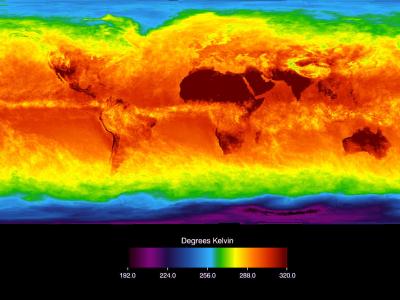
Early data was collected by technicians using mercury thermometers, where any variation in the visit time impacted measurements. In the 1940s, the construction of airports caused many weather stations to be moved. In the 1980s, there was a move to electronic thermometers that are said to have a cooling bias.
Given this complexity, there are a range of organizations that collate climate trends data. The three most cited land and ocean temperature data sets are NOAA’s MLOST, NASA’s GISTEMP and the UK’s HadCrut.
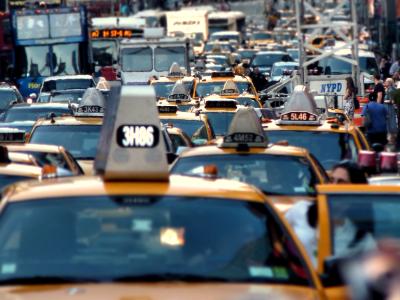
The TMC maintains a map of traffic speed detectors throughout the City. The speed detector themselves belong to various city and state agencies. The Traffic Speeds Map is available on the DOT's website. This data feed contains 'real-time' traffic information from locations where DOT picks up sensor feeds within the five boroughs, mostly on major arterials and highways. DOT uses this information for emergency response and management.
The metadata defines the fields available in this data feed and explains more about the data.