Starfish color image from Berkely dataset.
- Categories:

Starfish color image from Berkely dataset.

We collect almost 248,166 public microblogs according to selected 97 hashtags of "Top 100" on Instagram. The final collection contains 56861 microblogs which include both text and image, called MultiModal data from Instagram (MM-INS). We filter duplicate hashtags in one sample and drop out those microblogs without texts.

Test systems are important tools and benchmark for power system research. Currently, there is a lack of standard test systems for modern transmission expansion planning (TEP) research, especially under high variable renewable energy (VRE) penetrations. This paper describes a 38-bus test system named the HRP-38 system dedicated to TEP. “HRP” stands for high renewable penetration. The objective of establishing such a system is to provide a consistent platform for different TEP methods to be tested and compared.

Passive wireless actuators have advantages similar to passive wireless sensors, which is also suitable for use in human body or sealed spaces that require wireless operation or control. This paper proposes a passive wireless switching array based on MEMS switches. By inductive coupling, AC signals are used as power as well as control signals at the same time. The switching system includes four switching branches, each of which is composed of a receiving inductor, an AC-DC convert circuit, a MEMS switch, and a load.

Basic bibliometric analysis of the IoT

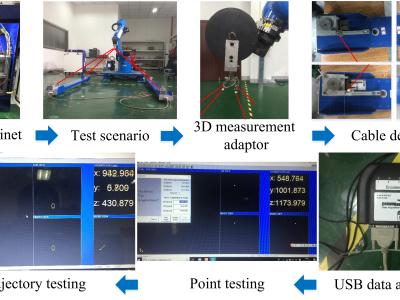
Experiments are conducted on a polishing industrial robot using the CompuGauge robot performance analysis system. The aim of this experiment is to explore the influences of link dimension errors and joint torsional angle errors on the positional accuracy reliability for single coordinate, single point, multipoint and trajectory accuracy of industrial robots.

The original AirQuality dataset is downloaded from UCI\footnote{http://archive.ics.uci.edu/ml/datasets/Air+Quality}. CentralAirConditioning is a semi-open access dataset for Chinese National Contest of Maths Models\footnote{http://www.tipdm.org/bdrace/index.html}. The last two oilwell maintenance datasets are provided by China National Offshore Oil Corporation (CNOOC)\footnote{http://www.cnooc.com.cn/en/}.

Dataset for an article in IEEE Transactions on Industrial Informatics

Normal 0 false false false EN-US X-NONE X-NONE

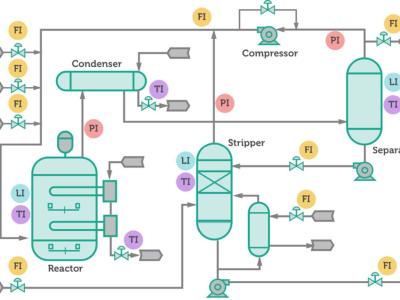
Tenessee Eastman (TE) process simulates actual chemical processes and is widely used as a benchmark in test fault diagnosis and process control. The overall process consists of five operating units: reactor, condenser, vapor-liquid separator, recycle compressor and product stripper. It has standard training and test data sets for fault detection and diagnosis, classification, etc. Each data set is under different operating conditions。