Machine Learning
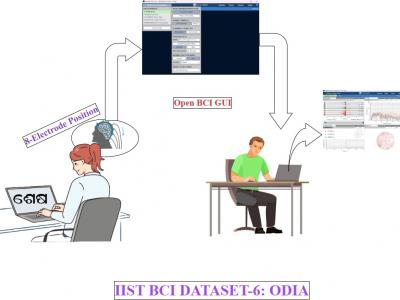
Brain-Computer Interface (BCI) is a technology that enables direct communication between the brain and external devices, typically by interpreting neural signals. BCI-based solutions for neurodegenerative disorders need datasets with patients’ native languages. However, research in BCI lacks insufficient language-specific datasets, as seen in Odia, spoken by 35-40 million individuals in India. To address this gap, we developed an Electroencephalograph (EEG) based BCI dataset featuring EEG signal samples of commonly spoken Odia words.
- Categories:
 323 Views
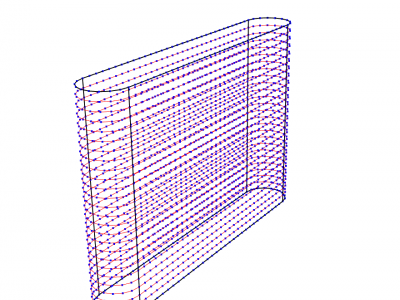
This dataset contains simulation values from thermo-mechanical finite element analysis simulations using ABAQUS. Each simulation is one of 192 unique process parameter settings which includes varying laser power, scan speed, layer height and cooling assumptions. The geometry for each simulation is a hollow rectangluar box with rounded corners such that they form semi-circles. The wall thickness of each simulation is exactly the width of the focused laser.
- Categories:
125 Views
The dataset consists of around 335K real images equally distributed among 7 classes. The classes represent different levels of rain intensity, namely "Clear", "Slanting Heavy Rain", "Vertical Heavy Rain", "Slanting Medium Rain", "Vertical Medium Rain", "Slanting Low Rain", and "Vertical Low Rain". The dataset has been acquired during laboratory experiments and simulates a low-altitude flight. The system consists of a visual odometry system comprising a processing unit and a depth camera, namely an Intel Real Sense D435i.
- Categories:
258 Views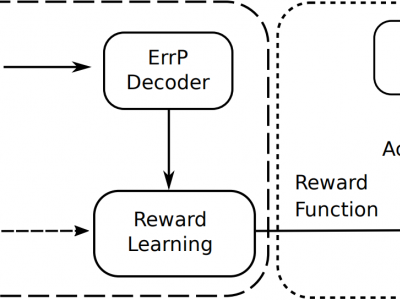
This dataset contains EEG error-related potential signals elicited by humans while observing an AI agent play an atari-based maze game.
- Categories:
140 Views
This dataset consists of inertial, force, color, and LiDAR data collected from a novel sensor system. The system comprises three Inertial Measurement Units (IMUs) positioned on the waist and atop each foot, a color sensor on each outer foot, a LiDAR on the back of each shank, and a custom Force-Sensing Resistor (FSR) insole featuring 13 FSRs in each shoe. 20 participants wore this sensor system whilst performing 38 combinations of 11 activities on 9 different terrains, totaling over 7.8 hours of data.
- Categories:
320 Views
We use a total of 16 datasets, detailed descriptions of which are provided in Table II. Among them, 11 datasets are from the UCI database, the DLBCL-Harvard dataset is from the ELVIRA biomedical database, Yale and ORL
- Categories:
93 Views
The training trajectory datasets are collected from real users when exploring the volume dataset on our interactive 3D visualization framework. The format of the training dataset collected is trajectories of POVs in the Cartesian space. Multiple volume datasets with distinct spatial features and transfer functions are used to collect comprehensive training datasets of trajectories. The initial point is randomly selected for each user. Collected training trajectories are cleaned by removing POV outliers due to users' misoperations to improve uniformity.
- Categories:
95 Views
<p>This dataset contains symptoms and disease information. It contains total of 1325 symptoms covered with 391 disease.This dataset is refernced from website MedLinePlus. This dataset have training and testing dataset and can be used to train disease prediction algorithm . It is created on own for project disease prediction and do not involves any funding or promotional terms.</p>
- Categories:
4545 Views
Subjects are categorized into three groups based on office blood pressure threshold: Normal (N), Prehypertension (P), and Stage 1 Hypertension (S). Each group contains 100 subjects, and all records have duration of at least 8 minutes. This study uses sliding window with length of 1 second and step size of 1 second to segment records. PPG, ECG and BP yield 167432 segments, respectively. MAP, DBP, and SBP are defined as average, minimum, and maximum of each BP segment, respectively. Max-Min normalization is applied to PPG and ECG segments.
- Categories:
437 Views
This dataset comprises three benchmarks: Digits-5, PACS, anf office_caltech_10. Digits-5 is a set of handwritten digit images sampled from five domains: MNIST, MNIST-M, USPS, SynthDigits, and SVHN. All sample are images of numbers ranging from 0 to 9. PACS is composed of four different datasets, each representing a different visual domain: Photo, Art Painting, Cartoon, and Sketch. It contains 9,944 images, including 1,792 real photos, 2,048 art paintings, 2,344 cartoon images, and 2,760 sketches.
- Categories:
124 Views