Climate Change/Environmental

These datasets are gathered from an array of four gas sensors to be used for the odor detection and recognition system. The smell inspector Kit IX-16 used to create the dataset. each of 4 sensor has 16 channels of readings. Odors of different 12 samples are taken from these six sensors
1- Natural Air
2- Fresh Onion
3- Fresh Garlic
4- Black Lemon
5- Tomato
6- Petrol
7- Gasoline
8- Coffee
9- Orange
10- Colonia Perfume
- Categories:
 393 Views
These datasets are gathered from an array of six gas sensors to be used for the odor recognition system. The sensors those used to create the data set are; Df-NH3, MQ-136, MQ-135, MQ-8, MQ-4, and MQ-2.
odors of different 10 samples are taken from these six sensors
1- Natural Air
2- Fresh Onion
3- Fresh Garlic
4- Fresh Lemon
5- Tomato
6- Petrol
7- Gasoline
8- Coffee 1,2
9- Orange
10- Colonia Perfume
- Categories:
 566 Views
16.00
Normal
0
false
false
false
EN-GB
X-NONE
X-NONE
- Categories:
 289 Views
This data repository comprises three distinct datasets tailored for different predictive modeling tasks. The first dataset is a synthetic dataset designed to simulate multivariate time series patterns, incorporating both linear and non-linear dependencies among input and target features. The second dataset, the Beijing Air Quality PM2.5 dataset, consists of PM2.5 measurements alongside meteorological data like temperature, humidity, and wind speed, with the objective of predicting PM2.5 concentrations.
- Categories:
 358 Views
The accurate classification of landfill waste diversion plays a critical role in efficient waste management practices. Traditional approaches, such as visual inspection, weighing and volume measurement, and manual sorting, have been widely used but suffer from subjectivity, scalability, and labour requirements. In contrast, machine learning approaches, particularly Convolutional Neural Networks (CNN), have emerged as powerful deep learning models for waste detection and classification.
- Categories:
 946 Views
The provided dataset appears to contain weather-related information for New Delhi Safdarjung, India, spanning from January 1, 2023, to July 21, 2023. The dataset includes the following columns: Station ID, Station Name, Date, Precipitation (PRCP), Average Temperature (TAVG), Maximum Temperature (TMThe dataset includes daily observations with information on precipitation and temperature. It seems that some values are missing (NULL values), and there are variations in the units used for precipitation AX), and Minimum Temperature (TMIN).
- Categories:
 2066 Views
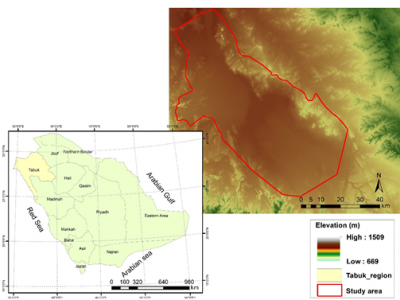
In this short communication we present the results taken from the real-time weather dataset of Tabouk City, Saudi Arabia. In the results we have applied machine learning techniques to predict the future air temperature of the region. This dataset's results have informed in the creation of determinants driving agricultural and urban expansion contribute to the analysis of the main causes of land use change.
- Categories:
 51 Views
In this short communication we present the results taken from the real-time weather dataset of Tabouk City, Saudi Arabia. In the results we have applied machine learning techniques to predict the future air temperature of the region. This dataset's results have informed in the creation of determinants driving agricultural and urban expansion contribute to the analysis of the main causes of land use change.
- Categories:
 12 Views
Climate change has been a worldwide concern for more than 50 years now and climate change misinformation has also been a critical issue as it questions the causes and effects of climate change, hence disturbing climate action. Climate misinformation has been a major obstacle to mitigating climate change and its effects, and it even aggravated the issue and polarized the public. In this paper, we introduce a new climate change misinformation and stance detection dataset namely ClimateMiSt, consisting of both social media data and news article data with manually verified labels.
- Categories:
 794 Views
ERA5 derived time series of European country-aggregate electricity demand, wind power generation and solar power generation: hourly data from 1979-2019. The ERA5 reanalysis data (1979-2019) has been used to calculate the hourly country aggregated wind and solar power generation for 28 European countries based on a distribution of wind and solar farms which is considered to be representative of the 2017 situation. In addition a corresponding daily time series of nationally aggregated electricity demand is provided.
- Categories:
 542 Views

