Power and Energy
We introduce a novel dataset containing a total of 61 distinct HEAs. The proposed appliances (e.g. fans, fridges, washers, etc.) are of different kinds, ages, brands and power
levels. They have been recorded in steady-state conditions in a French 50 Hz electrical grid. The measurement setup consists of an AC current probe (E3N Chauvin Arnoux) with a 10 mV/A sensitivity and a differential voltage probe with
- Categories:
 1455 Views
The paper introduces an analytical approach to predict the no-load flux density spatial repartition of inner permanent magnet tubular-linear synchronous machines (IPM T-LSMs). It considers a trapezoidal waveform whose maximum value is predicted using a simple magnetic equivalent circuit of an elementary part of the machine. Then, the accuracy of the proposed approach is enhanced by the incorporation of a mover permeance function that accounts for the PM luxconcentrating arrangement.
- Categories:
 156 Views
A Traffic Light Controller PETRI_NET (Finite State Machine) Implementation.
An implementation of FSM approach can be followed in systems whose tasks constitute a well-structured list so all states can be easily enumerated. A Traffic light controller represents a relatively complex control function
- Categories:
 514 Views
This dataset contains system data used in the numerical simulations in the paper Unlocking Reserves with Smart Transmission Switching by Raphael Saavedra, Alexandre Street, and José M. Arroyo.
- Categories:
 124 Views
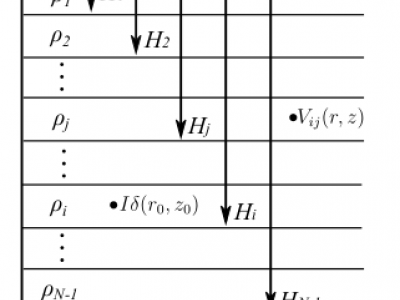
This paper introduces a novel model for the electric current dissipation through a horizontally stratified multilayer soil, for any point source location and calculated for every coordinate in space. The soil characteristic functions, which describe the application of boundary conditions for each layer transition
- Categories:
 222 Views
This data set containts the detailed parameters of the modified Kundur's two-area system that is used in the manuscript "Hybrid Symbolic-Numeric Library for Power System Modeling and Analysis"
- Categories:
 736 Views
Dataset of the paper entitled: "A stochastic distribution system market clearing and settling model with distributed renewable energy constraints"
- Categories:
 383 Views
The purpose of distribution network reconfiguration (DNR) is to determine the optimal topology of an electricity distribution network, which is an efficient measure to reduce network power losses. Electricity load demand and photovoltaic (PV) output are uncertain and vary with time of day, and will affect the optimal network topology. Single-hour deterministic DNR is incapable of handling this uncertainty and variability. Therefore, this paper proposes to solve a multi-hour stochastic DNR (SDNR).
- Categories:
 1957 Views
The dataset contains internal faults in power transformer and phase angle regulators (PAR) in a 5-bus interconnected system. It also has 6 other power system transients which include magnetising inrush, sympathetic inrush, external faults with CT saturation, capacitor switching, non-linear load switching, and ferroresonance. There are 88128 internal fault files and 12780 files of other transient disturbances. The faults and transients are simulated in PSCAD/EMTDC and the output files are in text format.
- Categories:
 3697 Views
Dataset containing normal insulator images captured by UAVs and synthetic defective insulator images.
- Categories:
 2797 Views

