Excel

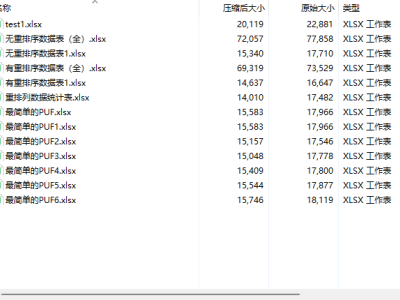
The dataset is based on PYTHON and machine modeling of 5000 challenge response pairs for both regular CRO PUFs and HMCRO PUFs.This includes the design of reordering schemes

The dataset is based on PYTHON and machine modeling of 5000 challenge response pairs for both regular CRO PUFs and HMCRO PUFs.This includes the design of reordering schemes

The dataset is based on PYTHON and machine modeling of 5000 challenge response pairs for both regular CRO PUFs and HMCRO PUFs.This includes the design of reordering schemes

Categories:
128 Views

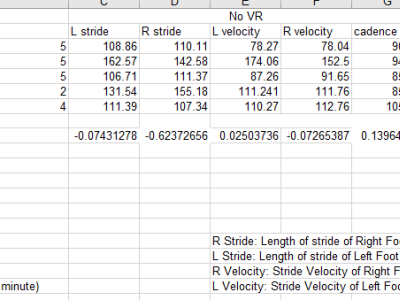
The dataset gives information about the different gait metrics such as stride length for left and right foot, stride velocity for left and right foot and cadence collected from human subjects


in a controlled environment in the presence of VR(virtual reality) scenes such as positve, negative and neutral. The PHQ-9 score of the subjects is collected and correlated with


the gait score. Decriptive statitics such as median are also collected for the difference in the gait values of specific VR environments.


Categories:
195 Views

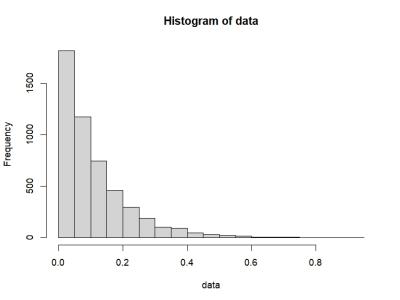
This dataset consists of a simulated exponential distribution data, featuring n=5000n = 5000n=5000 data points, each generated with a rate parameter of 9. The exponential distribution is commonly used to model the time between events in a Poisson process, where the rate parameter indicates the average number of events occurring in a unit of time. In this case, the relatively high rate parameter of 9 suggests that events are expected to happen frequently.

Categories:
485 Views

 This study proposes a stabilization approach when applying $N$th-order compensation for the average consensus of a multi-agent system affected by non-uniform, asymmetric, and time-varying delays in a communication network.

A continuous-time linear dynamical system with a local discrete-time controller modeled for each agent.

In our previous study, we proposed a packet selection algorithm that always selects the most recent packet and a synchronization algorithm that compensates for asymmetric delays to achieve an average consensus considering first-order compensation.

Categories:
13 Views

Interest-based e-commerce survey data. The questionnaire consists of seven sections: The first part includes seven questions about respondents' basic information and platform usage behavior, aimed at determining if the respondents are suitable for this study. The second to seventh parts pertain to the measurement of research variables, covering user interactions, interactions with celebrities, visual appeal, perceived enjoyment, purchase intention, and self-indulgence, totaling 24 questions.

Categories:
80 Views

The Big Five Inventory-2 (BFI-2) is one of the most used questionnaires to assess personality traits, distinguishing 15 facets. Despite its usage, there is still room for research to improve its psychometric properties. We applied the Rasch analysis (RA) to transform the BFI-2 into an instrument consisting of actual interval scales (obtaining the BFI-2-R), involving 5362 Italian adults. Five confirmatory factor analyses supported the three-facet structure of each trait. This structure resulted invariant at the scalar level across sex.

Categories:
167 Views

Contributions: This study offers valuable insights to MOOC designers about user priorities associated with web accessibility principles for designing web content that provides higher levels of user experience, motivating course completions. Background: MOOCs improve access to quality education. Despite policy support and more involvement by leading educational institutions worldwide, poor course completion rates undermine the objectives for MOOC diffusion.

Categories:
1 Views

Contributions: This study offers valuable insights to MOOC designers about user priorities associated with web accessibility principles for designing web content that provides higher levels of user experience, motivating course completions. Background: MOOCs improve access to quality education. Despite policy support and more involvement by leading educational institutions worldwide, poor course completion rates undermine the objectives for MOOC diffusion.

Categories:
Views

CTCS-2 level train control engineering data is primarily categorized into trackside infrastructure data and line parameters, including line velocity table, line gradient table, line broken chain detail table, balise position table, main line signal data table and so on. The dataset image above is an example of a balise position table.

Categories:
226 Views

Pages