
Normal 0 false false false EN-US X-NONE AR-SA
- Categories:
Normal 0 false false false EN-US X-NONE AR-SA
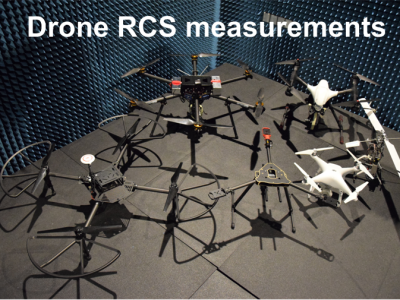
The dataset contains measurement results of Radar Cross Section of different Unmanned Aerial Vehicles at 26-40 GHz. The measurements have been performed fro quasi-monostatic case (when the transmitter and receiver are spatially co-located) in the anechoic chamber. The data shows how radio waves are scattered by different UAVs at the specified frequency range.
Overview

We introduce a dataset concerning electric-power consumption-related features registed in seven main municipalities of Nariño, Colombia, from 2010 to 2016. The dataset consists of 4423 socio-demographic characteristics, and 6 power-consumption-referred measured values. Data were fully collected by the company Centrales Eléctricas de Nariño (CEDNEAR) according to the client consumption records.

Traditional Static Timing Analysis (STA) assumes only single input switches at a time with the side input held at non-controlling value. This introduces unnecessary pessimism or optimism which may cause degradation of performance or chip failure. Modeling Multi-Input Switching (MIS) requires a good amount of simulations hence we provide a dataset comprising of SPICE simulations done on 2 input NAND and NOR gate.
The development of technology also influences changes in campaign patterns. Campaign activities are part of the process of Election of Regional Heads. The aim of the campaign is to mobilize public participation, which is carried out directly or through social media. Social media becomes a channel for interaction between candidates and their supporters. Interactions that occur during the campaign period can be one indicator of the success of the closeness between voters and candidates. This study aims to get the pattern of campaign interactions that occur on Twitter social media channels.


Dataset consists of various open GIS data from the Netherlands as Population Cores, Neighbhourhoods, Land Use, Neighbourhoods, Energy Atlas, OpenStreetMaps, openchargemap and charging stations. The data was transformed for buffers with 350m around each charging stations. The response variable is binary popularity of a charging pool.