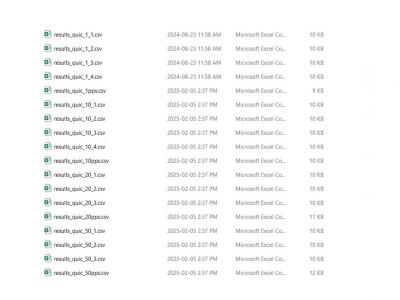
*.csv
This dataset contains results and scripts from experiments evaluating the resilience of the QUIC protocol against handshake flooding attacks. It aims to support researchers and developers in analyzing the performance of QUIC against handshake flooding attacks. The experiments utilize three prominent QUIC implementations: aioquic, quic-go, and picoquic, providing a comprehensive comparison of their resilience. Additionally, to benchmark the performance and resilience of QUIC, SYN flood attacks were conducted against TCP with SYN cookies.
- Categories:
 216 Views
Gait Event Detection (GED) plays a pivotal role in understanding human locomotion, with applications spanning rehabilitation, prosthesis design, sports science, and biomechanics. Accurate identification of key gait events—such as Heel Strike (HS), Loading Response (LS), Mid-Stance (MS), and Heel Off (HO)—during the stance phase of the gait cycle is essential for analyzing movement patterns, diagnosing gait abnormalities, and developing assistive technologies.
- Categories:
 189 Views
The Explainable Sentiment Analysis Dataset provides annotated sentiment classification data for Amazon Reviews and IMDB Movie Reviews, facilitating the evaluation of sentiment analysis models with a focus on explainability. It includes ground-truth sentiment labels, model-generated predictions, and fine-grained classification results obtained from various large language models (LLMs), including both proprietary (GPT-4o/GPT-4o-mini) and open-source models (DeepSeek-R1 full and distilled models).
- Categories:
 202 Views
The Software Engineering Skillset Dataset focuses on three critical areas: Soft Skills, Life Skills, and Technical Skills. These components are essential for assessing and predicting the software engineering competencies of computer science students. Data for the dataset was collected through a carefully designed questionnaire, targeting students enrolled in software engineering courses at higher educational institutions across Kerala, India. Over two thousand students participated in the survey, which used a dedicated assessment quiz with fifteen questions to evaluate each skill category.
- Categories:
 88 Views
This dataset contains the .csv files of simulation results of virtual power line operation in the Kundur four machine two area system, and the Nordic 44 test system. This includes data based on a state space model of the system, and quasi-static simulations using DIgSILENT PowerFacory. The data is divided according to figure numbers, which correspond to the figures in a paper on the very same topic that has been submitted to IEEE Transactions on Power Systems. For more details on nomenclature, units etc., please see "Instructions".
- Categories:
 44 Views
Access to continuous, quality assessed meteorological data is critical for understanding the climatology and atmospheric dynamics of a region. Research facilities like Oak Ridge National Laboratory (ORNL) rely on such data to assess site-specific climatology, model potential emissions, establish safety baselines, and prepare for emergency scenarios. To meet these needs, on-site towers at ORNL collect meteorological data at 15-minute and hourly intervals.
- Categories:
 40 Views
The file contains the numerical data for simulation of the application case reported in the paper "Adaptive Feedforward Grid-Forming Controls to Preserve Inertial Capabilities in Power Systems". The paper presents a novel adaptive feedforward grid-forming control, which is specifically designed to preserve the inertial capabilities of grid-forming controls without feedforward terms, and at the same time to ensure the damping capabilities provided by the feedforward grid-forming converters to the system.
- Categories:
 71 Views
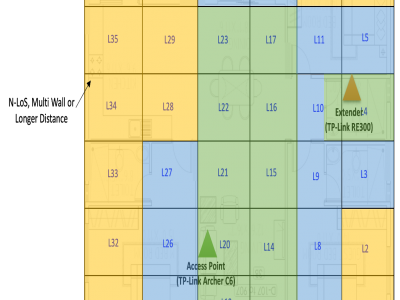
This dataset supports the BWiFi framework, an intelligent method to identify optimal Wi-Fi zones in mesh networks. The home dataset, collected over one month across 36 zones, and the office dataset, collected over two months across 40 zones, systematically measure Wi-Fi quality and application performance metrics. Using clustering techniques and heuristic analysis, BWiFi evaluates zone performance to recommend optimal connectivity areas.
- Categories:
 613 Views
Performance models identified at run-time can be used by self-adaptive software systems to execute decisions on a cloud environment. These performance models are built by measuring the control inputs, disturbances, and outputs of the controlled system. These models have been shown to accurately interpolate for data already seen by the model identification method. However, automation in cloud operations can push the environment into operational regions the system has not seen, thus the performance model may not accurately extrapolate into unseen regions.
- Categories:
 69 Views
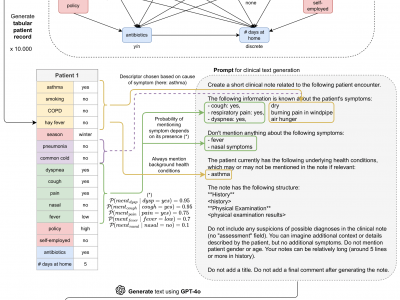
We present the SynSUM benchmark, a synthetic dataset linking unstructured clinical notes to structured background variables. The dataset consists of 10,000 artificial patient records containing tabular variables (like symptoms, diagnoses and underlying conditions) and associated clinical notes describing the fictional patient encounter in the domain of respiratory diseases. The tabular portion of the data is generated through a Bayesian network, where both the causal structure between the variables and the conditional probabilities are proposed by an expert based on domain knowledge.
- Categories:
 235 Views


