Datasets
Standard Dataset
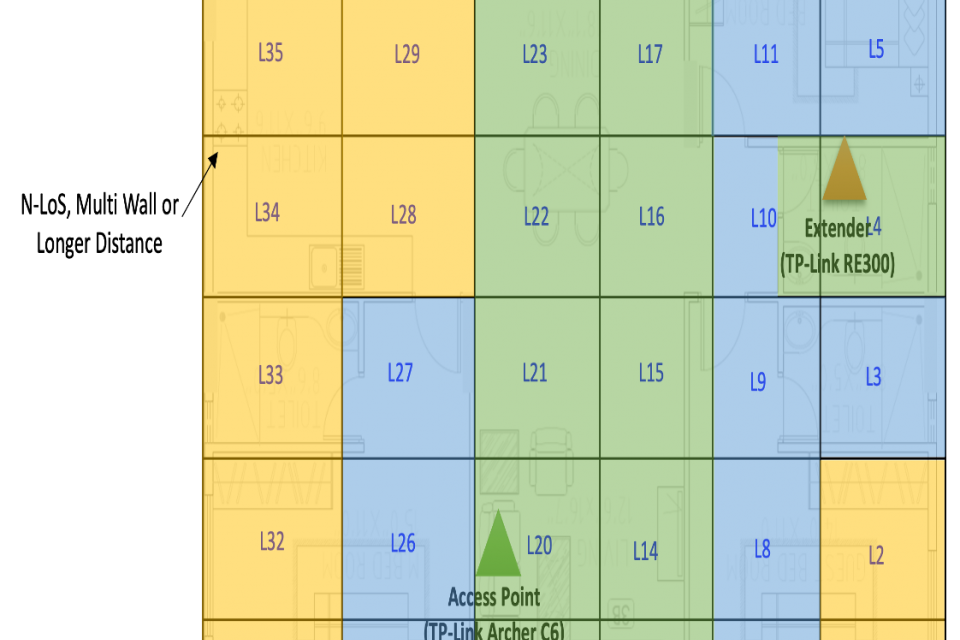
Best Wi-Fi Zone Dataset in Home & Office
- Citation Author(s):
- Submitted by:
- Kavin Thangadorai
- Last updated:
- Wed, 01/22/2025 - 12:23
- DOI:
- 10.21227/1dr2-ae34
- Data Format:
- License:
 613 Views
- Categories:
- Keywords:
Abstract
This dataset supports the BWiFi framework, an intelligent method to identify optimal Wi-Fi zones in mesh networks. The home dataset, collected over one month across 36 zones, and the office dataset, collected over two months across 40 zones, systematically measure Wi-Fi quality and application performance metrics. Using clustering techniques and heuristic analysis, BWiFi evaluates zone performance to recommend optimal connectivity areas. The datasets demonstrate improved Wi-Fi performance, including up to 17 dB Signal-to-Noise Ratio gain, a 4% Packet Error Rate reduction, and 15 ms lower latency. These insights validate BWiFi's effectiveness for enhancing user experience in real-world scenarios.
Instructions for Interpreting the BWiFi Dataset
The BWiFi datasets include metrics collected from home (36 zones over one month) and office (40 zones over two months) environments, showcasing Wi-Fi quality and application performance. Below are guidelines for interpreting the dataset features:
-
LocationNumber:
- Represents the zone number where data was collected.
- Ranges from 1–36 for the home dataset and 1–40 for the office dataset.
-
RSSI (dBm):
- Received Signal Strength Indicator, showing the signal strength at the given location.
- Higher values (closer to 0) indicate better signal quality.
-
PER (%):
- Packet Error Rate, indicating the percentage of packets lost or requiring retransmission.
- Lower values indicate more reliable connectivity.
-
TxLinkSpeed (Mbps) and RxLinkSpeed (Mbps):
- Represent the transmission and reception link speeds, respectively, between the client and the Access Point (AP).
- Higher values indicate faster data transfer rates.
-
ChannelUtil (%):
- Channel utilization percentage, showing how much of the channel is being used.
- Lower utilization suggests less interference and congestion.
-
MainAPConnect:
- A binary feature indicating whether the client is connected to the Main AP (
1) or an extender (0). - Helps differentiate performance between AP and extender zones.
- A binary feature indicating whether the client is connected to the Main AP (
-
TxThroughput (Mbps) and RxThroughput (Mbps):
- Represent the actual transmission and reception throughput achieved in the respective zone.
- These values reflect real-world performance during data collection.
-
AvgPingLatency (ms):
- Average latency measured using ping tests to a server.
- Lower latency is essential for applications like video calls and gaming.
-
TotalTxMB (MB) and TotalRxMB (MB):
- Total transmitted and received data volumes in megabytes.
- Used to track overall data usage per zone.
-
Environment Setup:
- Home Dataset: Collected in a 36-zone home environment with one AP and one extender.
- Office Dataset: Collected in a 40-zone office layout with one AP and three extenders across two floors.
Usage Notes:
- The dataset supports performance evaluation for Wi-Fi mesh networks.
- Correlations between features like RSSI, PER, and throughput can help identify zones with optimal connectivity.
- Recommended zones (best Wi-Fi zones) can be derived using clustering and heuristic techniques, as demonstrated in the associated BWiFi paper.
These datasets enable researchers and developers to validate machine learning techniques for enhancing Wi-Fi performance and user experience.


Comments
Hi Kavin,
I am Pengfei, a researcher and I am working on testing machine learning model to identify wifi network issues. I found your dataset might be a good source for serving this purpose. Could I request this dataset?
Best,
Pengfei