Other

MS-BioGraphs are a family of sequence similarity graph datasets with up to 2.5 trillion edges. The graphs are weighted edges and presented in compressed WebGraph format. The dataset include symmetric and asymmetric graphs. The largest graph has been created by matching sequences in Metaclust dataset with 1.7 billion sequences. These real-world graph dataset are useful for measuring contributions in High-Performance Computing and High-Performance Graph Processing.
- Categories:
 609 Views
The Cora dataset consists of 2708 scientific publications classified into one of seven classes. The citation network consists of 5429 links. Each publication in the dataset is described by a 0/1-valued word vector indicating the absence/presence of the corresponding word from the dictionary. The dictionary consists of 1433 unique words.
- Categories:
422 Views
The e-commerce market heavily relies on e-coupons, and their digital nature presents challenges in establishing a secure e-coupon infrastructure, which incurs maintenance costs. To address this, we explore using public blockchains for the e-coupon system, providing a highly reliable decentralized infrastructure with no maintenance costs. Storing coupon information on a blockchain ensures tamper resistance and protection against double redemption. However, using public blockchains shifts gas cost responsibility to users, potentially impacting user experience if not managed carefully.
- Categories:
154 Views
We report a continuous-wave Ti:sapphire laser with an output power of 1.03 W, achieved with two low-cost single-emitter diode pumps, both of blue wavelength (448 and 468 nm). Using a novel strategy of combining blue-wavelength pumping with a long, low-doping Ti:sapphire crystal, we maximise the available pump power while minimising deleterious effects associated with blue pump wavelengths, demonstrating Watt-level output powers.
- Categories:
84 Views
This study investigates whether the ingredients listed on restaurant menus can provide insights into a city's socioeconomic status. Using data from an online food delivery system, the study compares menu items with local education rates and rental prices. A machine learning model is developed to predict menu prices based on ingredients and socioeconomic factors. An efficiency metric is proposed to cluster restaurants to address autocorrelation, comparing ingredient averages to socioeconomic indicators.
- Categories:
250 Views
No image data exists.The number of activities in the event logs are 52, 68, 30, 36, 35, and 56, respectively. Each event logs contains 2000 traces with 4 different average trace lengths. The event logs are divided into two categories: noisy and noise-free. In this paper, we selected 6 event logs with varying numbers of activities for experimentation. In addition, we have selected real event logs related to finance BPI2012_Loan origination and BPI201_Financial.
- Categories:
26 Views
Researchers have widely used commercial and alternative measurement systems in impedance-based structural health monitoring (SHM), where a piezoelectric transducer attached to the monitored structure is excited while its electrical impedance is measured. However, the literature lacks sufficient attention to the required number of cycles of the excitation signal, an issue frequently overlooked by researchers.
- Categories:
79 Views
This dataset is in support of my research paper 'Statistical Variability Study of RDF and LER on Nanosheet FETs at Sub 3nm Node'. In this study, we studied the influence of RDF and LER on NSFETs through NEGF method for simulation. The results are generated by simulation software, Nano-electronic Simulation Software (NESS), which was developed by the University of Glasgow’s Device Modelling Group. Our results predict the figures of merit of nanosheet devices at different channel lengths and widths with the influence of RDF and LER.
- Categories:
98 Views
Finger Scanning Experiments: Participants conducted experiments while seated and wearing an eye mask to eliminate visual information. They were instructed to horizontally scan the surface back-and-forth eight times with one of their fingers to assess surface roughness. The finger's motion was optically captured at a frame rate of 60 fps. Scanning speed was determined by measuring finger positions at each frame and dividing them by the frame length. Image analysis was performed using OpenCV, where the finger outline was extracted from the video.
- Categories:
93 Views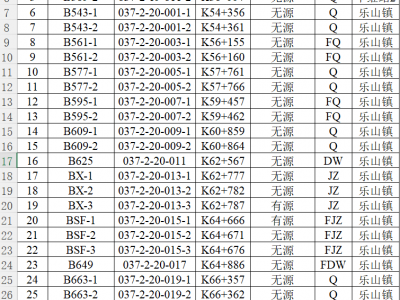
CTCS-2 level train control engineering data is primarily categorized into trackside infrastructure data and line parameters, including line velocity table, line gradient table, line broken chain detail table, balise position table, main line signal data table and so on. The dataset image above is an example of a balise position table.
- Categories:
224 Views