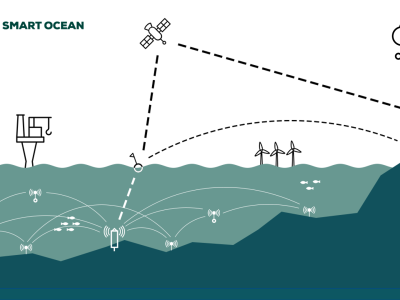
Signal Processing

A non-destructive testing system requires multiple system configuration parameters during the operation process. For a given transducer, scanning frequency and number of measurements for averaging are just among those parameters. This work tests the central limit theorem to optimally set these parameters. The authors have designed a compact ultrasound computer tomography scanner from scratch just to test this criterion. It is shown that optimal frequency value changes with respect to the scanning angle for an object with a heterogeneous inner profile.

Categories:
17 Views

We discuss the use of multi-rate FIR filters in radio frequency (RF) transient spectroscopy as well as the implementation challenges these multi-rate filters face when used in this application to reduce the sampling rate (decimation) and raise the sampling rate (interpolation). On a Texas Instruments TMS320-C30 DSP processor, all implementation measurements given here were carried out.

Categories:
95 Views

This dataset is made of the Channel Impulse Response (CIR) data collected in 9 different environments in Ghent city, Belgium. These environments include:

1.  Fourth floor at iGent Tower in the premises of Gent University

2. Zwijnaarde Open Area

3. Stadhuis Street and Nearby

4. Zuid Mall

5. Portus Ganda

6. Sint-Pieters Railway Station

7. Krook library

8. Citadel Park

9. Graffiti Straat

Categories:
279 Views

In this dataset, we provided the raw analog-to-digital-converter (ADC) data of a 77GHz mmwave radar for the automotive object detection scenario. The overall dataset contains approximately 19800 frames of radar data as well as synchronized camera images and labels. For each radar frame, its raw data has 4 dimension: samples (fast time), chirps (slow time), transmitters, receivers. The experiment radar was assembled from the TI AWR 1843 board, with 2 horizontal transmit antennas and 4 receive antennas.

Categories:
3124 Views

In this dataset, we provided the raw analog-to-digital-converter (ADC) data of a 77GHz mmwave radar for the carry object detection scenario. The overall dataset contains approximately 3000 frames of radar data as well as synchronized camera images and labels. For each radar frame, its raw data has 4 dimensions: samples (fast time), chirps (slow time), transmitters, and receivers. The experiment radar was assembled from the TI cascaded-chip TIDEP-01012 board, with 12 transmit antennas and 16 receive antennas.

Categories:
732 Views

This dataset is a collection of phase samples retrieved from an in-house design for a Bluetooth Low Energy (BLE) 5.1 based receiver, using an 8-element Uniform Circular Array (UCA). The purpose of the dataset was the implementation of localization techniques based on the use of Angle-of-Arrival data, possible due to the BLE 5.1 Direction Finding (DF) features. Specifically, the phase differences of a Constant Tone Extension (CTE) read from the different antenna elements can be used to retrieve the AoA of a received packet.

Categories:
138 Views

This dataset containg EMG data recorded with a sample rate of 1kHz. Data was collected from  the brachioradialis, flexor carpi ulnaris and common extensor digitorum muscles.

Categories:
288 Views

This dataset is used to create the results and figures presented on the manuscript: Ben Moshe et al., "Empirical Study on the Effect of Birds on Commercial Microwave Links and its Application for Bird" Detection".


Application for Bird Detection"

Categories:
63 Views

The Firearm Recoil Dataset was collected utilizing a wrist worn accelerometer to record the recoil generated from one subject’s use of 15 different firearms of the Handgun, Rifle and Shotgun class. The type of the firearm based on its ability to auto-load or not is also denoted. 

Categories:
695 Views

MATLAB code for test spectrum sensing algorithm based on statistical processing of instantaneous magnitude (SPIM). The associated SCRIPTs allow: Generating different signals to check the method, FHSS, LFM, CW Pulse, etc. Plot the generated signal, the detection threshold and compare it with the ideal detection. Determine the errors for the different hypotheses based on SNR. Calculate errors in the determination of the amplitude and frequency for different SNRs. Evaluate the probability of detection with different threshold control values A and U.

Categories:
249 Views

Pages