TXT

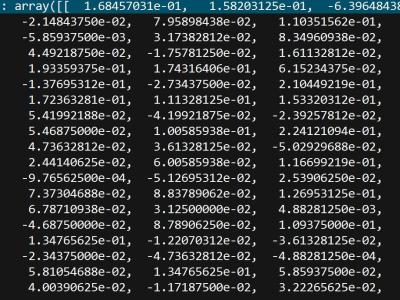
The data format is described as follows:

Event: {‘acc’: array([[x_axis], [y_axis], [z_axis], ‘gyr’,array([x_axis], [y_axis], [z_axis], ‘label’: No ]

No =1 means acceleration.

No =2 means normal driving.

No =3 means collision.

No =4 means left turn.

No =5 means right turn.


The dataset was analyzed and disclosed in the paper "Vehicle Driving Behavior Recognition Based on Multi-View Convolutional Neural Network (MV-CNN) with Joint Data Augmentation" for the first time.

Categories:

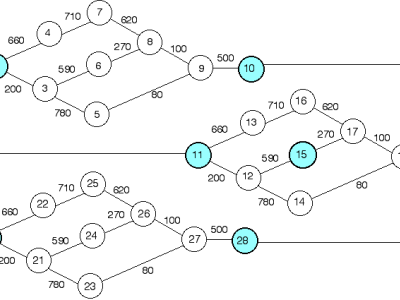
This paper describes a set of 300 pseudo-random task graphs which can be used for evaluating Mobile Cloud, Fog and Edge computing systems. The pseudo-random task graphs are based upon graphs that have previously appeared in IEEE papers. The graphs are described in Matlab code, which is easy to read, edit and execute. Each task has an amount of computational work to perform, expressed in Mega-cycles per second. Each edge has an amount of data to transfer between tasks, expressed in Kilobits or Kilobytes of data.

Categories:

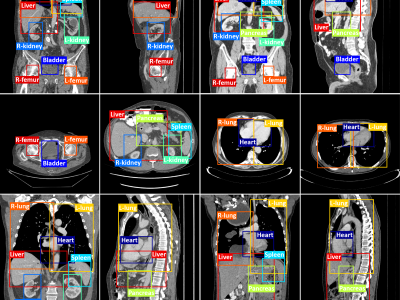
For the development and evaluation of organ localization methods, we build a set of annotations of organ bounding boxes based on the MICCAI Liver Tumor Segmentation (LiTS) challenge dataset. Bounding boxes of 11 body organs are included:  heart (53/28), left lung (52/21), right lung (52/21), liver (131/70), spleen (131/70), pancreas (131/70), left kidney (129/70), right kidney (131/69), bladder (109/67), left femoral head (109/66) and right femoral head (105/66). The number in the parentheses indicates the number of the organs annotated in training and testing sets.

Categories:

This dataset includes  the Channels Switch Sequences of 300 IPTV viewers in Guangzhou, P.R. China, in Augest, 2014. There are 4 columns in the file, which represent viewer ID, the current channel number, the next channel number, the date of the month, respectively. The first column, the ID code of a viewer, ranks in descent with the times the viewer watched tv channels. The more times a viewer watches tv channels, the bigger the ID is. In a day, the rows are time series and generated step by step as the real watching tv behavior. 


Categories:

This dataset includes  the Channels Switch Sequences of 300 IPTV viewers in Guangzhou, P.R. China, in Augest, 2014.

There are 4 columns in the file, which represent viewer ID, the current channel number, th next channel number, the date of the month, respectively.

The first column, the ID code of a viewter, ranks with the times the viewer watched tv channels. The more times a viewer watches tv channels, the bigger

the ID is. In a day, the rows are time series and generated step by step as the real watching tv behavior. 


Categories:
RSSI-Dataset

The RSSI-Dataset provides a comprehensive set of Received Signal Strength Indication (RSSI) readings from within two indoor office buildings. Four wireless technologies were used:

  • Zigbee (IEEE 802.15.4),
  • WiFi (IEEE 802. 11),
  • Bluetooth Low Energy (BLE) and
  • Long Range Area-Wide Network (LoRaWAN).

For experimentation Arduinos Raspberry Pi, XBees, Gimbal beacons Series 10 and Dragino LoRa Shield were also used.  

Categories: