
*.npy

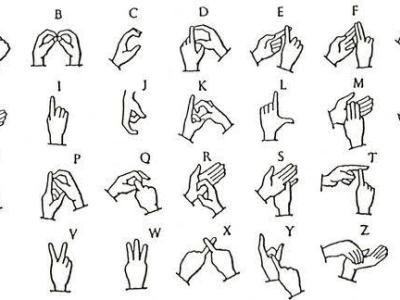
The dataset consists of NumPy arrays for each alphabet in Indian Sign Language, excluding 'R'. The NumPy arrays denote the (x,y,z) coordinates of the skeletal points of the left and right hand (21 skeletal points each) for each alphabet. Each alphabet has 120 sequences, split into 30 frames each, giving 3600 .np files per alphabet, using MediaPipe.

The dataset is created on the basis of skeletal-point action recognition and key-point collection.
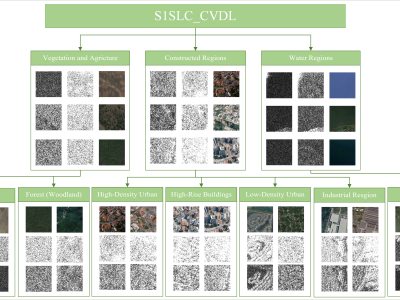
Categories:

Development of the Complex-Valued (CV) deep learning architectures has enabled us to exploit the amplitude and phase components of the CV Synthetic Aperture Radar (SAR) data. However, most of the available annotated SAR datasets provide only the amplitude information (Only detected SAR data) and disregard the phase information. The lack of high-quality and large-scale annotated CV-SAR datasets is a significant challenge for developing CV deep learning algorithms in remote sensing.

Categories:

The dataset contains laser-induced fluorescence spectral data in different noise modes. We used sodium humate and glucose according to the prepared solutions.

First, we prepared 100 mg per liter of f sodium humate solution A and glucose solution B. Depending on the molecular weight, solution A was prepared using 100 ml of water and 0.0149 g of sodium humate. solution B was prepared using 100 ml of water and 0.01584 g of glucose.

Subsequently, solution A and solution B were mixed in a ratio of 1:29 to obtain 100 mg per liter of sodium humate and glucose solution C.

Categories:

Synthetic Aperture Radar (SAR) satellite images are used increasingly more for Earth observation. While SAR images are useable in most conditions, they occasionally experience image degradation due to interfering signals from external radars, called Radio Frequency Interference (RFI). RFI affected images are often discarded in further analysis or pre-processed to remove the RFI.

Categories:

Future mobile communication systems include millimeter wave (mmWave) frequency bands and high mobility scenarios. To learn how wave propagation and scattering effects change from classical sub 6 GHz to mmWave frequencies, measurements in both bands have to be conducted. We perform wireless channel measurements at 2.55 GHz and 25.5 GHz center frequency at velocites of 40 km/h and 100 km/h. To ensure a fair comparison between these two frequency bands, we perform repeatable measurements in a controlled environment.

Categories:

Good knowledge about a radio environment, especially about the radio channel, is a prerequisite to design and operate ultra-reliable communications systems. Radio Environment Maps (REMs) are therefore a helpful tool to gain channel awareness. Based on a user’s location, the channel conditions can be estimated in the surrounding of the user by extracting the information from the radio map. This data set contains two measured high-resolution REMs of an indoor environment.

Categories:

YonseiStressImageDatabase is a database built for image-based stress recognition research. We designed an experimental scenario consisting of steps that cause or do not cause stress; Native Language Script Reading, Native Language Interview, Non-native Language Script Reading, Non-native Language Interview. And during the experiment, the subjects were photographed with Kinect v2. We cannot disclose the original image due to privacy issues, so we release feature maps obtained by passing through the network.

Categories: