warehouse dataset
- Citation Author(s):
-
ANSELME HERMAN EYELEKO

- Submitted by:
- Anselme Herman EYELEKO
- Last updated:
- DOI:
- 10.21227/6rbm-rs12
- Data Format:
 35 views
- Categories:
- Keywords:
Abstract
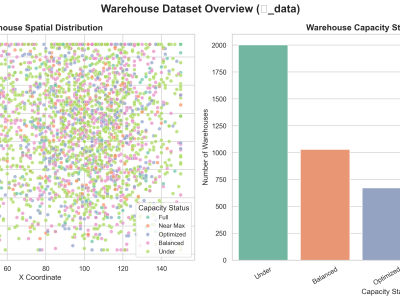
This dataset, denoted as 𝑾_data, represents a synthetic yet structurally authentic warehouse management dataset comprising 4,132 records and 11 well-defined attributes. It was generated using the Gretel.ai platform, following the structural standards provided by the TI Supply Chain API–Storage Locations specification. The dataset encapsulates essential operational and spatial parameters of warehouses, including unique identifiers, geospatial coordinates, storage capacities, and categorical capacity statuses. Each warehouse entry includes derived metrics such as squared coordinates and storage utilization rates, supporting comprehensive spatial and efficiency analyses. Designed to facilitate research in warehouse optimization, logistics planning, supply chain analytics, and resource allocation, this clean, well-balanced dataset reflects realistic attribute distributions and interdependencies. It is ideally suited for benchmarking algorithms in logistics optimization, classification, clustering, and spatial modeling tasks in industrial and academic applications.
Instructions:
📘 Instructions for Use of Dataset and Analysis Tools
This dataset, titled Warehouse Capacity and Spatial Logistics Dataset ($\mathcal{W}_{\text{data}}$), provides a synthetic yet realistic representation of warehouse infrastructure and operational capacity across multiple spatial coordinates. It is designed to support research and development in the areas of warehouse logistics optimization, capacity utilization, supply chain management, spatial analytics, and intelligent resource allocation.
🔧 Dataset Contents
- Format: CSV
- Size: 4,132 records × 11 attributes
- Source: Synthesized using Gretel.ai based on structure referenced from TI Supply Chain API – Storage Locations
📊 Suggested Tasks for Competitions and Research
Researchers and participants are encouraged to utilize the dataset for a wide variety of data-driven logistics and AI challenges, including but not limited to:
- Clustering & Classification
- Segment warehouses by capacity status, geography, or utilization patterns
- Predict Capacity Status using spatial and operational variables
- Outlier Detection
- Identify anomalous facilities based on unusual capacity usage or spatial isolation
- Optimization Algorithms
- Develop algorithms for optimizing storage distribution and facility deployment
- Geospatial Analysis
- Explore spatial clustering or coverage using
XandYcoordinates
- Explore spatial clustering or coverage using
- Feature Importance & Ranking
- Compute feature relevance for warehouse classification or ranking
🛠️ Recommended Analysis Tools
- Python Libraries:
pandas,numpy– Data manipulationmatplotlib,seaborn,plotly– Visualizationscikit-learn– ML modeling and clusteringxgboost,lightgbm– Advanced classification/regressiongeopandas,folium– Optional geospatial mapping
- Notebooks/Environments:
- Jupyter Notebook
- Google Colab
- VSCode + Python
📥 Getting Started
- Download the CSV file and load it using Python (e.g.,
pd.read_csv("warehouse_dataset.csv")) - Check for structure & preview:
df.head(),df.info() - Perform preprocessing if needed (note: the dataset is already clean and balanced)
- Select a challenge such as classification, prediction, clustering, or logistics optimization
- Document your methodology and results for reproducibility
✅ Licensing and Ethics
This dataset is synthetic and does not contain personal or sensitive data. It is shared under a CC BY 4.0 license, and you are free to use it for academic, educational, and research purposes with appropriate citation.


good
good