Artificial Intelligence
This is the collection of the Ecuadorian Traffic Officer Detection Dataset. This can be used mainly on Traffic Officer detection projects using YOLO. Dataset is in YOLO format. There are 1862 total images in this dataset fully annotated using Roboflow Labeling tool. Dataset is split as follow, 1734 images for training, 81 images for validation and 47 images for testing. Dataset is annotated only as one class-Traffic Officer (EMOV). The dataset produced a Mean Average Precision(mAP) of 96.4 % using YOLOv3m, 99.0 % using YOLOv5x and 98.10 % using YOLOv8x.
- Categories:
 385 Views
This dataset is shared for capacitor C and ESR estimation using convolution neural network. The dataset is collected in a experimental modular moultilevel converter, which includes the capacitor voltage at low and medium frequency band, and the arm current. Wavelet transform is used to transfer the time series data to images, which present the inherent data features to image patterns. In a degraded capacitor, the C decreases and the ESR increases, which result in different image patterns.
- Categories:
 339 Views
Our dataset comes from the paper called "XBlock-ETH: Extracting and exploring blockchain data from Ethereum", the datasets are the on-chain data obtained by running all nodes of Ethereum. For the purpose of the experiment, we only selected block transactions from 0-2,000,000 blocks. These datasets are sufficient to support the experiments. You can get more details and analysis from the paper called "XBlock-ETH: Extracting and Exploring Blockchain Data from Ethereum". The citation of the paper as follows: P. Zheng, Z. Zheng, J. Wu, and H.-N.
- Categories:
 277 Views
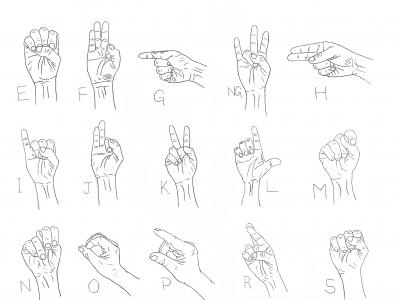
In today’s world, deaf and mute person face many problems in their daily life due to miscommunication as well as misunderstanding. These problems have existed since long ago but are ultimately being solved with the introduction of Hand sign language. There exist many different sign languages such as ASL, ISL, etc. But for regional and low-resource languages like Mizo, the state language of Mizoram, spoken by the northeastern people in India, not much research has been done on the advancement of sign language based on the Mizo language.
- Categories:
 403 Views
In today’s world, deaf and mute person face many problems in their daily life due to miscommunication as well as misunderstanding. These problems have existed since long ago but are ultimately being solved with the introduction of Hand sign language. There exist many different sign languages such as ASL, ISL, etc. But for regional and low-resource languages like Mizo, the state language of Mizoram, spoken by the northeastern people in India, not much research has been done on the advancement of sign language based on the Mizo language.
- Categories:
 182 Views
This large dataset includes six small datasets, including two types, one contains the original node relationship information and node feature information, please use it through the common network construction methods; the other is the dataset which has been processed, including the direct edge information and node's association information, which can be used to construct the network directly through the network construction methods.
Translated with www.DeepL.com/Translator (free version)
- Categories:
 175 Views
In the evolving landscape of 5G network, network slicing has been considered as a key technology for the realization of multiple virtual networks running on a shared physical infrastructure, each designed to fulfill a specific service or application. However, with such networks, the dynamic and real-time allocation of these resources remains a prime concern, particularly with respect to highly variable conditions of traffic.
- Categories:
 301 Views
The data set is from the Case Western Reserve University Rolling Bearing data set. SK6205 bearing located at the drive end is selected as the research object, and the acquisition frequency is 12KHz. The fault type is divided into three types, namely inner ring fault, rolling body fault and outer ring fault, and each fault type is divided into three fault sizes: 0.007, 0.014 and 0.021 inches.The length of each sample is 1024 and the repetition rate is 50%
- Categories:
 619 Views
We collected fundus photos from the Kangnam Sacred Heart Hospital, Hallym University School of Medicine, Seoul, South Korea (IRB approval number: 2022-10-026), that were obtained from 2000 to September 2022. The fundus photographs were taken by five skilled examiners using the KOWA Nonmyd 8S Fundus Camera (KOWA company, Japan). Among the 2,000 images, we chose 50 test images that were characterized as ``bad-quality'' due to one of the following reasons: media opacity, small pupil, or poor patient cooperation.
- Categories:
 137 Views