Artificial Intelligence

Dataset from UCI contains the electricity consumption (in kWh) of 320 customers every 15 minutes from 2011 to 2014. For some customers, their electricity consumption data was recorded starting from a different time, and the data before the first record was marked as 0. As training model requires a starting point for the time series, and different customers have different starting times, some features remain 0 before a certain time point. Using all the data for training would inevitably have a negative impact. Therefore, the data from 2011 is removed and set the starti
- Categories:
 341 Views
Study on Sleep Positions using a Wearable Device
This device constantly collects data about acceleration in three directions (tri-axial) 50 times a second (50 Hz). It has several components: a microcontroller for gathering and sending data (ESP8266), a battery (lithium-ion), a sensor for measuring acceleration (ADLX345 accelerometer), and a protective case made of plastic. The device can also store data temporarily on a microSD card in case the wireless connection is lost.
- Categories:
 180 Views
The provided data package contains Livox LiDAR scan data from the Calar simulation platform, capturing scenarios in three distinct tunnels, each with various obstacles. The dataset includes LiDAR data recorded at different distances from the sensor, . Additionally, the data encompasses varying numbers of obstacles.
- Categories:
 109 Views
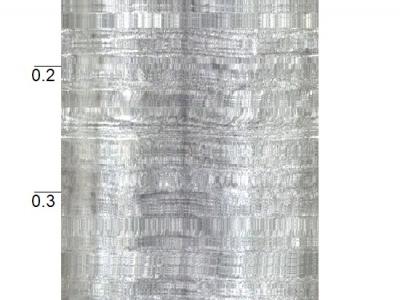
The identification of rock fractures in strata is crucial to enhance the intelligence of rock detection. Traditional fracture feature extraction methods suffer from issues such as low accuracy and low processing speed, necessitating the development of more effective approaches. To address this problem, this study proposes a new fracture instance segmentation network called FracSeg. Based on the SOLOv2 framework, we incorporated the Swin Transformer to optimize the backbone network and enhance fracture feature extraction.
- Categories:
 169 Views
This dataset consists of inertial, force, color, and LiDAR data collected from a novel sensor system. The system comprises three Inertial Measurement Units (IMUs) positioned on the waist and atop each foot, a color sensor on each outer foot, a LiDAR on the back of each shank, and a custom Force-Sensing Resistor (FSR) insole featuring 13 FSRs in each shoe. 20 participants wore this sensor system whilst performing 38 combinations of 11 activities on 9 different terrains, totaling over 7.8 hours of data.
- Categories:
 218 Views
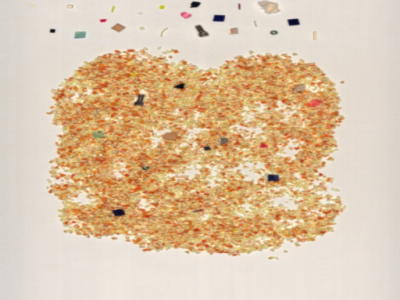
Hyperspectral imaging captures material-specific spectral data, making it highly effective for detecting contaminants in food that are challenging to identify using conventional methods. In the food industry, the occurrence of unknown contaminants is particularly problematic due to the difficulty in obtaining training data. This highlights the need for anomaly detection algorithms that can identify previously unseen contaminants by learning from normal data. This dataset is designed to test anomaly detection performance in normal data that contains impurities.
- Categories:
 24 Views
The training trajectory datasets are collected from real users when exploring the volume dataset on our interactive 3D visualization framework. The format of the training dataset collected is trajectories of POVs in the Cartesian space. Multiple volume datasets with distinct spatial features and transfer functions are used to collect comprehensive training datasets of trajectories. The initial point is randomly selected for each user. Collected training trajectories are cleaned by removing POV outliers due to users' misoperations to improve uniformity.
- Categories:
 90 Views
This study is based on the image data of cement concrete pavement diseases collected by myself. The mobile phone is fixed on the sun visor of the passenger seat of the vehicle, and all kinds of diseases on the road are photographed along with the vehicle. Based on 1,595 images, each image is expanded to 4 by using the data enhancement method. After screening, a total of 2,925 images are obtained, including 2,125 defective images with shadow occlusion and uneven illumination.
- Categories:
 62 Views
Subjects are categorized into three groups based on office blood pressure threshold: Normal (N), Prehypertension (P), and Stage 1 Hypertension (S). Each group contains 100 subjects, and all records have duration of at least 8 minutes. This study uses sliding window with length of 1 second and step size of 1 second to segment records. PPG, ECG and BP yield 167432 segments, respectively. MAP, DBP, and SBP are defined as average, minimum, and maximum of each BP segment, respectively. Max-Min normalization is applied to PPG and ECG segments.
- Categories:
 366 Views
This dataset comprises three benchmarks: Digits-5, PACS, anf office_caltech_10. Digits-5 is a set of handwritten digit images sampled from five domains: MNIST, MNIST-M, USPS, SynthDigits, and SVHN. All sample are images of numbers ranging from 0 to 9. PACS is composed of four different datasets, each representing a different visual domain: Photo, Art Painting, Cartoon, and Sketch. It contains 9,944 images, including 1,792 real photos, 2,048 art paintings, 2,344 cartoon images, and 2,760 sketches.
- Categories:
 108 Views

