Anomaly detection with hyperspectral imaging for food safety inspection
- Citation Author(s):
-
Jungi Lee (ELROILAB)Myounghwan Kim (ELROILAB)Jiseong Yoon (ELROILAB)Kwangsun Yoo (ELROILAB)Seok-Joo Byun (ELROILAB)
- Submitted by:
- Jungi Lee
- Last updated:
- DOI:
- 10.21227/963e-1d34
- Research Article Link:
 195 views
- Categories:
- Keywords:
Abstract
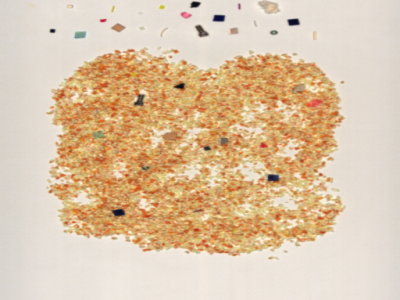
Hyperspectral imaging captures material-specific spectral data, making it highly effective for detecting contaminants in food that are challenging to identify using conventional methods. In the food industry, the occurrence of unknown contaminants is particularly problematic due to the difficulty in obtaining training data. This highlights the need for anomaly detection algorithms that can identify previously unseen contaminants by learning from normal data. This dataset is designed to test anomaly detection performance in normal data that contains impurities. The hyperspectral images were obtained at ELROILAB with an SPECIM FX10 camera which captures 400-1000 nm wavelength. It consists of three types of normal samples, each including one training data set and one test data set. The training data consists solely of normal samples, while the test data includes 42 impurities along with normal data. This dataset is suitable for evaluating model performance in the field of food safety inspection, where impurity data is typically absent, as it includes various impurities in the test data. By providing a diverse range of impurities in the test data, this dataset enables a comprehensive assessment of anomaly detection algorithms' ability to identify contaminants in real-world scenarios.
Instructions:
The dataset comprises three hyperspectral image datasets-almond, pistachio, and garlic stems. The hyperspectral images were obtained at ELROILAB with an SPECIM FX10 camera which captures 400-1000 nm wavelength. We use two hyperspectral images each for training and testing. The training data has dimensions of 400x512x224, where 400 represents the number of lines, 512 denotes the size of each line, and 224 corresponds to the number of spectral bands, with all training samples belonging to a single class (normal). The test data whose shape is identical to the training data has an additional class for anomalies with 42 foreign materials, e.g.) plastic, rubber, paper, and metal. The number of abnormal samples in almond, pistachio, and garlic stems datasets are 3199 (1.56%), 3255 (1.59%), and 2639 (1.29%), respectively. The rest of the data are labeled as normal samples.


