Cognitive Fatigue Assessment Using Physiological Sensors during Human-Robot Interaction for Activities of Daily Living

- Citation Author(s):
-
Manizheh Zand (Santa Clara University)Glenn Wylie (Kessler Foundation )Andrew Wolfe (Santa Clara University)Maria Kyrarini (Santa Clara University)
- Submitted by:
- Maria Kyrarini
- Last updated:
- DOI:
- 10.21227/zdfm-kp95
 172 views
- Categories:
- Keywords:
Abstract
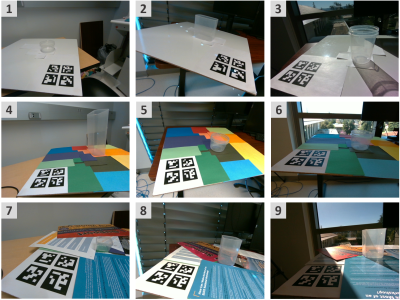
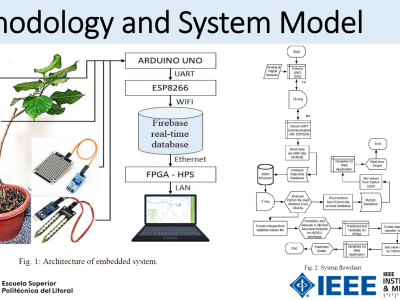
A multimodal dataset is presented for the cognitive fatigue assessment of physiological minimally invasive sensory data of Electrocardiography (ECG) and Electrodermal Activity (EDA) and self-reporting scores of cognitive fatigue during HRI. Data were collected from 16 non-STEM participants, up to three visits each, during which the subjects interacted with a robot to prepare a meal and get ready for work. For some of the visits, a well-established cognitive test was used to induce cognitive fatigue. The developed cognitive fatigue assessment framework filtered noise from the raw signals, extracted relevant features, and applied machine learning regression algorithms, such as Support Vector Regression (SVR), Gradient Boosting Machine (GBM), and Random Forest Regressor (RFR) for estimating the Cognitive Fatigue (CF) level.
Instructions:
The dataset is accessible in the supplementary materials and consists of data collected from 16 participants. Each participant’s folder is labeled with a unique identifier in the format ID' followed by the participant's specific ID number. Inside each participant folder, subfolders correspond to individual visits. Each visit folder contains two primary files: (1) ECG_EDA.csv, which includes electrocardiogram (ECG) and electrodermal activity (EDA) data, and (2) Events.csv, detailing event-specific information for that visit. The URL in the footnote contains sample CSV files.
The ECG_EDA.csv file comprises three columns: (1) Timestamp, with precision up to nanoseconds, (2) ECG value recorded at each timestamp, and (3) \ac{EDA} value corresponding to the same timestamp. The Events.csv file contains the following columns:
- `Participant ID`: The `Events.csv` file includes the column `Participant ID`, which indicates the unique identifier assigned to each participant.
- `Visit Number`: Represents the visit number for each participant. Per the guidelines established by the IRB, data collection is permitted over a maximum of three visits, so this column takes values of 1, 2, or 3.
- `Time of Participation`: Indicates when the participant arrived for the experiment.
- `Initial Fatigue Level`: A VAS-F score recorded upon the participant's arrival to assess initial fatigue. Based on the VAS-F score, this is typically categorized as Low CF (0–34), Medium CF (35–70), or High CF (71–100).
- Gender: Gender of the participant (optional).
- Age Group: Age group of the participant (optional).
- How much sleep did you get last night?: Hours of sleep the participant received the previous night.
- How many cups of caffeinated drinks did you have today?: Number of cups of caffeinated beverages the participant consumed on the day of the experiment.
- Rest mode time: Start and end timestamps of the rest mode, recorded at the beginning of the experiment and following the completion of the first scenario.
- Scenario 1 or 2: Indicates whether the activity pertains to the first or second scenario performed by the participant
- Cooking (0) or Go-out (1): Specifies whether the current scenario is related to "Cooking" or "Go-out."
- How many N-Backs before Scenario: Number of N-Back tasks completed by the participant before the scenario. For Low CF, this is 0; for Medium CF, this is 6.
- N-Back Start Time and End Time: Start and end timestamps for each N-Back task by the participant.
- N-Back Stimuli: Sequence of stimuli characters (e.g., A, B, A, A, ...) presented to the participant during the N-Back task.
- N-Back Final Score: The final score of the N-Back
- N-Back Baseline Score: Score that would be recorded if the participant did not engage with the task and merely observed the screen.
- N-Back Correct Reaction Times: Whenever a repetition occurs two steps ago, and the participant indicates it by clicking the button, it's called a correct reaction. The time between the character appearing on the screen and the person pressing it is the correct reaction time.
- N-Back Wrong Reaction Times: Whenever a repetition doesn't occur two steps ago, and the participant still indicates a repetition by clicking the button, it's called a negative reaction. The time between the character appearing on the screen and the person pressing it is the wrong reaction time.
- VAS-F score and time: The VAS-F after performing the activity and timestamp. It's taken at the start of the experiment, after every N-Back task, and after every scenario where the person interacts with the robot.
- Scenario Start and End Time: Start and end timestamps of the scenario during which the participant interacts with the robot.
- Speech Command: The participant gives the robot speech commands.
- Google Error: Indicates if there was any error in Google’s transcription during the participant's speech command.
- User Error: Indicates if the participant made an error by not adhering to the prescribed sentence structure, as instructed beforehand.
- Robot Error: Indicates whether any error occurred while the robot was retrieving the item requested by the participant.
- Time taken for each command: Total time elapsed from when the participant issued the speech command to when the robot successfully retrieved the item.
- MicroPhone Taps Time: Start and end timestamps of the participant's speech command to the robot, beginning when the microphone is tapped on, continuing as the participant speaks, and ending when the microphone is tapped off.
- SUS after Scenario and time: The SUS score recorded after the completion of each scenario.
The `ECG_EDA.csv` file is augmented with an additional VAS-F column for machine learning purposes. All VAS-F scores, with their corresponding timestamps recorded in `Events.csv`, are mapped to the closest matching timestamps in `ECG_EDA.csv` and populated in the VAS-F column. The initial signal data before the first VAS-F entry is then removed. This results in a dataset with VAS-F scores at certain rows while others remain empty. An interpolation method is applied to fill the empty rows, interpolating linearly between consecutive VAS-F scores until reaching the final VAS-F. Any data after the last VAS-F score is subsequently removed. This processed dataset is then utilized to train machine learning algorithms.


