Block-Oriented Systems
- Citation Author(s):
-
Prabhu VijayanPhilippe Dreesen
 (Maastricht University)
John Lataire
(Vrije Universiteit Brussel)
Mariya Ishteva
(KU Leuven)
(Maastricht University)
John Lataire
(Vrije Universiteit Brussel)
Mariya Ishteva
(KU Leuven)
- Submitted by:
- Prabhu Vijayan
- Last updated:
- DOI:
- 10.21227/v9j3-0z06
- Data Format:
 26 views
- Categories:
- Keywords:
Abstract
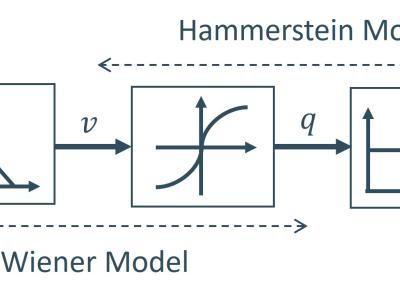
The dataset under consideration originates from an electronic system exhibiting Wiener, Hammerstein, and Wiener-Hammerstein block structures. These model structures are well-known as block-oriented structures. The Wiener system consists of a linear time-invariant (LTI) block cascaded with a static nonlinear (SNL) block. The Hammerstein system is the reverse of the Wiener system, where the linear dynamic block follows the SNL block. In the Wiener-Hammerstein (WH) system, a static nonlinearity is sandwiched between two linear time-invariant blocks, making its identification more challenging due to the interaction between these blocks.
The system being modeled is an electronic nonlinear system with a Wiener-Hammerstein configuration. The first filter in the system is a third-order Chebyshev filter with a pass-band ripple of 0.5 dB and a cut-off frequency of 4.4 kHz. The second filter is a third-order inverse Chebyshev filter designed with a stop-band attenuation of 40 dB starting at 5 kHz. This configuration introduces a transmission zero within the frequency band of interest, further complicating the identification process, as inverting such characteristics is inherently difficult. Additionally, the static nonlinearity is implemented using a diode circuit, adding another layer of complexity to the system.
In the Wiener system, the input is the input of the first LTI block, and the output is the output of the SNL block. In the Hammerstein system, the input is the input of the SNL block, and the output is the output of the second LTI block. For the WH system, the input is the input of the first LTI block, and the output is the output of the second LTI block.
Instructions:
Measurement system
The setup has two types of cards:
- arbitrary signal generators, used to apply the excitation signal,
- acquisition cards, to measure the signals
The generators are connected directly to the input of the system. The excitation applied to the system can be measured by splitting it with a BNC T piece connector.
The mat files contain following variables:
o P: number of periods to measure. In our case, P=6.
o Npp: number of samples per period.
o u: excitation signal of size Npp x M with Npp the number of samples and M the number of realizations. In our case, M=1.
o u_meas: measured input signal of size (Npp*P)xM.
o y_meas: measured output signal of size (Npp*P)xM.
o fs=10MHz/2r, where r=6, the sampling frequency.
o s_meas: standard deviation of the measurement.
The measured input and output can be used to identify the block-oriented systems and to identify or approximate their parameters. The order and degree of nonlinearity can be chosen based on the type of nonlinear used in your approach.