Financial

This study presents a English-Luganda parallel corpus comprising over 2,000 sentence pairs, focused on financial decision-making and products. The dataset draws from diverse sources, including social media platforms (TikTok comments and Twitter posts from authoritative accounts like Bank of Uganda and Capital Markets Uganda), as well as fintech blogs (Chipper Cash and Xeno). The corpus covers a range of financial topics, including bonds, loans, and unit trust funds, providing a comprehensive resource for financial language processing in both English and Luganda.
- Categories:
 377 Views
This code implements a novel family of generalized exponentiated gradient (EG) updates derived from an Alpha-Beta divergence regularization function. Collectively referred to as EGAB, the proposed updates belong to the category of multiplicative gradient algorithms for positive data and demonstrate considerable flexibility by controlling iteration behavior and performance through three hyperparameters: alpha, beta, and the learning rate eta. To enforce a unit l1 norm constraint for nonnegative weight vectors within generalized EGAB algorithms, we develop two slightly distinct approaches.
- Categories:
89 Views
This study utilizes the annual loan ledger data obtained from a commercial bank located in Jiangsu Province, China, which is called ChinaZJB. The ChinaZJB dataset consists of 1,329 valid samples of SMEs after merging the non-financial behavioral information and soft information on credit rating with the financial information, loan information, and non-financial basic information found in the annual loan ledger data.
- Categories:
1121 Views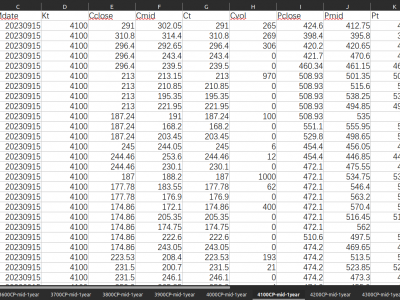
This dataset contains the SPX call and put option data from 16/09/2022 to 08/09/2023 with different strike prices ranges from 3500 to 4500 with an interval 100. The data for options with different strike prices are listed in different sheets. The price data of call and option options are listed togather in one row, including the date, price, volume and interest rate.
- Categories:
290 Views
ABSTRACT Analysis of stock prices has been widely studied because of the strong demand among private investors and financial institutions. However, it is difficult to accurately capture the factors that cause fluctuations in stock prices, as they are affected by a variety of factors. Therefore, we used non-harmonic analysis, a frequency technique with at least to more accurately than conventional analysis methods, to visualize the periodicity of the Nasdaq Composite Index stock price from January 4, 2010 to September 8, 2023.
- Categories:
94 Views
This study analyzes the spending of Brazilian municipalities on health using an approach based on computational intelligence. The study was characterized by a quantitative and documentary database, and 117 municipalities with an average population between 2004 and 2019 of more than 100,000 inhabitants were analyzed. The data was obtained from the Brazilian Finance database (Finbra) (National Treasury Secretariat) and processed and adjusted for inflation. The main technique used was cluster analysis via R software, version 3.3.3.
- Categories:
213 Views
This study investigates whether the ingredients listed on restaurant menus can provide insights into a city's socioeconomic status. Using data from an online food delivery system, the study compares menu items with local education rates and rental prices. A machine learning model is developed to predict menu prices based on ingredients and socioeconomic factors. An efficiency metric is proposed to cluster restaurants to address autocorrelation, comparing ingredient averages to socioeconomic indicators.
- Categories:
318 Views
The dataset tracks the performance of eight stock market indices, from six countries. The indices are: IPC, S\&P 500, DAX, DJIA, FTSE, N225, NDX, and CAC. The time period is from the 1st of June 2006 to the 31st of May 2023.The index and the FX data are sourced from Yahoo Finance, and the rest of the variables are retrieved from the OECD.
- Categories:
2065 Views
In general,the scale of a network is primarily measured by its number of nodes and edges. But we generated six data tables for each chain, with increasing scale (100, 1000, 5000, 10000, 50000, 100000) and time, based on the number of transitions. Significantly, the fetched data, being in CSV format, cannot be directly used for analysis. Therefore, it was necessary for this study to process the data and employ Pajek-formatted files for graph storage [19]. The subsequent data utilized in this research has been preprocessed into Pajek format.
- Categories:
88 Views
This dataset comes from the Wind database. This dataset includes a series of Shanghai Stock Exchange 50 ETF option data due in December 2022. This dataset also includes some economic variables.The data used in this article is the trading data of Shanghai Stock Exchange 50ETF call options. The time of option data is from April 28 to October 26, 2022, sourced from the WIND database. The exercise price range of the selected option is from 2.5 to 3.5 (European call options). In addition, the expiration date of the options in this experiment is December 28, 2022.
- Categories:
247 Views