Python algorithms and dataset of empirical line method applied to inland water hyperspectral images combining reference targets and in situ water measurements
- Citation Author(s):
- Submitted by:
- Alisson Fernando Carmo
- Last updated:
- DOI:
- 10.21227/fbks-rj40
- Data Format:
- Links:
 1289 views
- Categories:
- Keywords:
Abstract
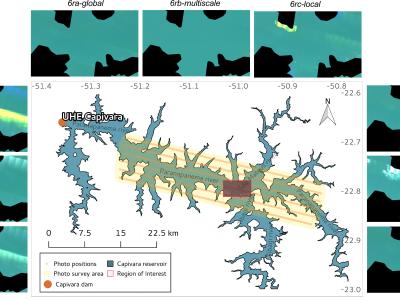
Empirical line methods (ELM) are frequently used to correct images from aerial remote sensing. Remote sensing of aquatic environments captures only a small amount of energy because the water absorbs much of it. The small signal response of the water is proportionally smaller when compared to the other land surface targets.
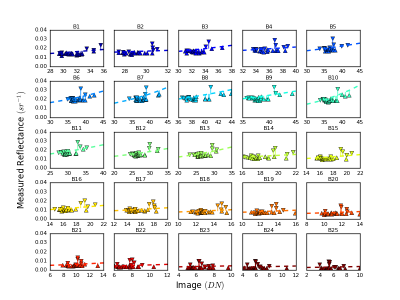
This dataset presents some resources and results of a new approach to calibrate empirical lines combining reference calibration panels with water samples. We optimize the method using python algorithms until reaches the best result.
We evaluated several combinations of targets using both linear and exponential fit.
All results are included: python scripts to calibrate and validate the ELM and also the entire dataset of 26 water spectrum.
Instructions:
The files are identified sequentially according to the processing step:
- A1-img-nd_samples.xlsx: Digital numbers of water samples extract from the hyperspectral image
- A2-img-nd_targets.xlsx: Digital numbers of reference targets extract from the hyperspectral image
- B1-asd-rad_refl_targets.xlsx: Radiance values collected with ASD HandHeld of the reference targets and calculated Reflectance
- B2-asd-simulatedbands_refl.xlsx: Target reflectance values calculated and simulated to match the hyperspectral camera response function
- C1-trios-rad_refl_samples.xlsx: Radiance values collected with TriOS of the water points and calculated Reflectance
- C2-trios-simulatedbands_refl.xlsx: Water reflectance values calculated and simulated to match the hyperspectral camera response function
- D1-nd_data.csv: Digital number extracted from the hyperspectral image (CSV format, this is the input of the algorithm)
- D1-nd_data.xlsx: Digital number extracted from the hyperspectral image (xlsx format)
- D2-r_data.csv: Reflectance calculated from the spectroradiometers measurements (CSV format, this is the input of the algorithm)
- D2-r_data.xlsx: Reflectance calculated from the spectroradiometers measurements (xlsx format)
- D3-r_nd_targets.xlsx: Agregation from D1 and D2 data to compare the data
- E1-calc_coef_line.py: Python algorithm to calibrate and validate the empirical line model
- Fit.py: Python script class to calculate the Fit of linear and exponential function
- output_graphs.zip: The results of the graphs generated for each of the evaluated combinations. In this package are different graphical representations for each of the combinations of samples and targets, as well as for the exponential and linear fits.
All files of the output folder are self-explained, because the filename identifies how the ELM was calibrated.
Details and descriptions about the full process steps are in the official paper (under journal review).
Dataset Files
- ELM_processing_allfiles.zip (Size: 4.74 MB)
- A1-img-nd_samples.xlsx (Size: 138.51 KB)
- A2-img-nd_targets.xlsx (Size: 14.28 KB)
- B1-asd-rad_refl_targets.xlsx (Size: 2.23 MB)
- B2-asd-simulatedbands_refl.xlsx (Size: 742.57 KB)
- C1-trios-rad_refl_samples.xlsx (Size: 1.26 MB)
- C2-trios-simulatedbands_refl.xlsx (Size: 484.05 KB)
- D1-nd_data.csv (Size: 10.64 KB)
- D1-nd_data.xlsx (Size: 24.41 KB)
- D2-r_data.csv (Size: 9.52 KB)
- D2-r_data.xlsx (Size: 28.52 KB)
- D3-r_nd_targets.xlsx (Size: 11.7 KB)
- output_graphs.zip (Size: 10.94 MB)


