Datasets
Standard Dataset
Measuring and Modeling Macrophage Growth Using a Lab-on-CMOS Capacitance Sensing Microsystem
- Citation Author(s):
- Submitted by:
- Marc Dandin
- Last updated:
- Thu, 04/06/2023 - 17:01
- DOI:
- 10.21227/h4bm-ac75
- Data Format:
- Research Article Link:
- License:
 181 Views
- Categories:
- Keywords:
Abstract
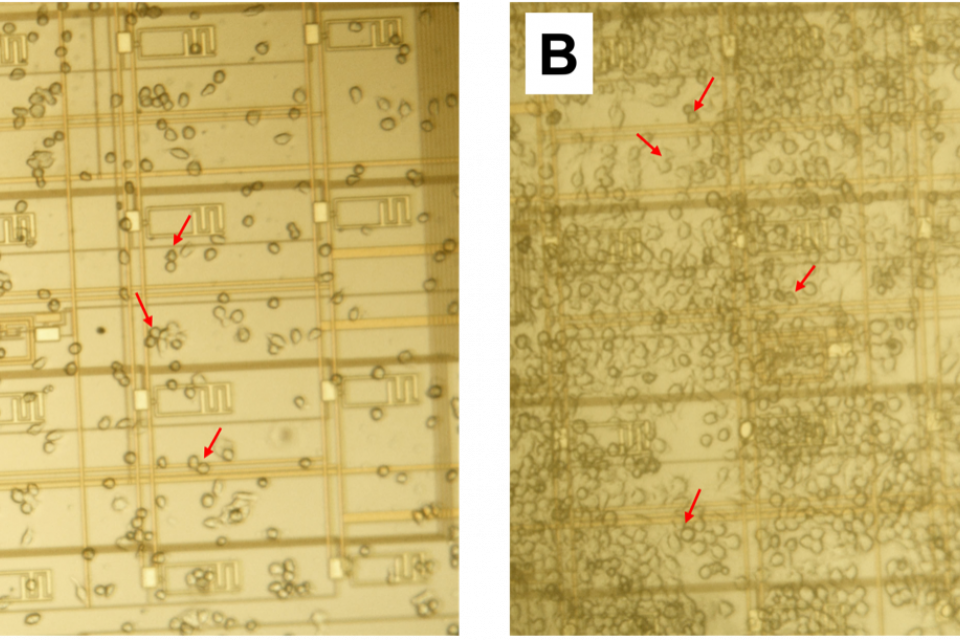
In this archive, we provide experimental data and software that were used in our study on macrophage proliferation using a lab-on-CMOS platform. The data are for RAW 264.7 murine Balb/c macrophages, which we cultured on a CMOS capacitance sensor. We show that macrophage growth over a wide sensing area correlates linearly with an average capacitance growth factor resulting from capacitance measurements at a plurality of electrodes dispersed in the sensing area. We further show a temporal model that captures the cell evolution in the area of interest over long periods (e.g., 30 hours). The model links the cell numbers and the average capacitance growth factor associated with the sensing area to describe the observed growth kinetics.
The dataset includes .csv files which contain measurement data from the sensor. The .csv files have 17 columns, the first column being the time vector. The remaining 16 columns are the measured capacitance data (in femtoFarads) from the 16 on-chip sensors. The Matlab m-files can be run to plot example charts like the ones reported in the linked paper. The .mp4 files show a ~48 hour time-lapse video showing sustained cell growth on the chip's surface. Furthermore, the cvCode.zip archive includes Python scripts and a sample image to evaluate the computer vision code used in the paper. A readme file is placed in the folder to help the user execute the scripts. Lastly, the dataset includes .mat files containing cell numbers as a function of time. These files are used by the aforementioned m-files.
Dataset Files
- macrophage_cap_dataset MacroPhageLabOnCMOS 2.zip (513.47 MB)


