
1D dataset

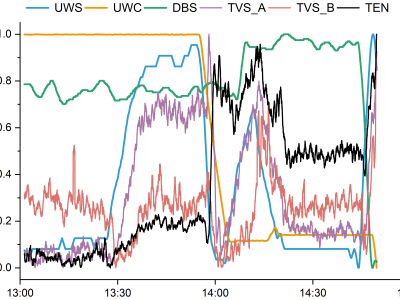
This graph illustrates the visualization trend of a subset of the dataset I have uploaded, which comprises 6500*9 data points. The dataset consists of nine columns representing underwater speed (UWS), underwater course (UWC), depth below the surface (DBS), rate of change in speed (RCS), rate of change in course (RCC), rate of change in depth (RCD), trend A and B of vibrational signals (TVS_A, TVS_B) and electromagnetic noise trend (TEN) recorded by the AUV.

Categories:

Clinical/Lab Data Quantitative Continuous age (years), height (cm), weight (kg), bmi (kg/m2) - Body Mass Index, hemoglobin

(g/dL) - Hemoglobin concentration, hba1c (%) - Glycated Hemoglobin, ast (U/L) -

Aspartate Aminotransferase, alt (U/L) - Alanine Aminotransferase, creatinine (mg/dL),

nt proBnp (pg/mL) - N-terminal pro b-type Natriuretic Peptide

Categorical Nominal gender (Male/Female), smoking status (Smoker/Non-smoker), htn (Yes/No) - Hypertension,

dm (Yes/No) - Diabetes Mellitus, ckd (Yes/No) - Chronic Kidney Disease

Categories:
Morse code is a system of communication using dots and dashes to represent numbers, letters and symbols. For example, the letter 'B' is represented as a dash followed by 3 dots, i.e. "–...". The dataset used in this competition is synthetically generated, and mimics a human writing dots and dashes on a piece of paper. In this sense, it is like a 1-dimensional version of an image represented by numeric pixel values.
Categories: