Cherry Tree Disease Detection Dataset
- Citation Author(s):
-
Christos Chaschatzis
 Ilias Siniosoglou
Anna Triantafyllou
Chrysoula Karaiskou
Athanasios Liatifis
Panagiotis Radoglou-Grammatikis
Dimitrios Pliatsios
Vasiliki Kelli
Thomas Lagkas
Vasileios Argyriou
Panagiotis Sarigiannidis
Ilias Siniosoglou
Anna Triantafyllou
Chrysoula Karaiskou
Athanasios Liatifis
Panagiotis Radoglou-Grammatikis
Dimitrios Pliatsios
Vasiliki Kelli
Thomas Lagkas
Vasileios Argyriou
Panagiotis Sarigiannidis
- Submitted by:
- Panagiotis Sarigiannidis
- Last updated:
- DOI:
- 10.21227/ehfm-9j20
- Data Format:
- Research Article Link:
 2939 views
- Categories:
- Keywords:
Abstract
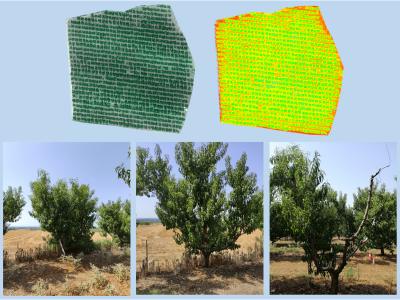
This cherry tree disease detection dataset is a multimodal, multi-angle dataset which was constructed for monitoring the growth of cherry trees, including stress analysis and prediction. An orchard of cherry trees is considered in the area of Western Macedonia, where 577 cherry trees were recorded in a full crop season starting from Jul. 2021 to Jul. 2022. The dataset includes a) aerial / Unmanned Aerial Vehicle (UAV) images, b) ground RGB images/photos, and c) ground multispectral images/photos. Two agronomist experts annotated the dataset by identifying a stress, which in this case is a common disease in cherry trees known as Armillaria.
Instructions:
Please cite the following papers when using this dataset:
C. Chaschatzis, C. Karaiskou, E. Mouratidis, E. Karagiannis, and P. Sarigiannidis, “Detection and Characterization of Stressed Sweet Cherry Tissues Using Machine Learning”, Drones, vol. 6, no. 1, 2022.
P. Radoglou-Grammatikis, P. Sarigiannidis, T. Lagkas, & I. Moscholios, “A compilation of UAV applications for precision agriculture,” Computer Networks, vol. 172, no. 107148, 2020.
A. Lytos, T. Lagkas, P. Sarigiannidis, M. Zervakis, & G. Livanos, “Towards smart farming: Systems, frameworks and exploitation of multiple sources,” Computer Networks, vol. 172, no. 107147, 2020.
In this dataset, an orchard of cherry trees is considered in the area of Western Macedonia, where 577 cherry trees were recorded in a full crop season starting from Jul. 2021 to Jul. 2022. The tree mapping within the orchard is depicted in Fig. 1. (ref to ReadMe file), where each circle represents a cherry tree. Labels on the circles (green, red etc) will be elaborated in the following Sections. The five time periods, where the orchard was recorded are: 8th of Jul. 2021, 16th of Sep. 2021, 3rd of Nov. 2021, 26th of May 2022, and 13th of Jul. 2022, providing data to a full year of life cycle.
The dataset includes a) aerial / Unmanned Aerial Vehicle (UAV) images, b) ground RGB images/photos, and c) ground multispectral images/photos. Two agronomist experts annotated the dataset by identifying a stress, which in this case is a common disease in cherry trees known as Armillaria [1][2]. In particular, the following modalities are featured in the dataset:
- Ground RGB images;
- Ground multispectral images;
- UAV/Aerial images (RGB, multispectral, and NDVI).
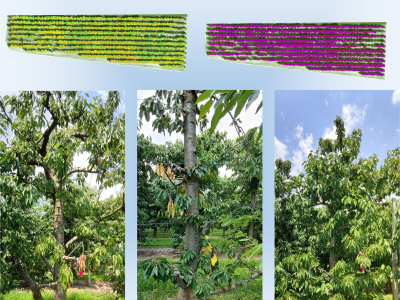
These modalities represent the cherry tree cultivation in many levels. Each modality describes the same object (cherry tree) within the dataset, i.e., for each tree within. For example, Fig. 2 show RGB images, Fig. 3 illustrates multispectral images, and Fig. 4 provides UAV images (Ref to the ReadMe file). All images show the same cherry trees under three (RGB, multispectral, and UAV) aspects
This dataset was annotated by two agronomist experts in terms of disease stage (Armillaria). In particular, they annotated each cherry tree, one by one, in four levels of disease stage:
- Healthy: the cherry tree is completely healthy;
- Stage1: Armillaria is present in light form in the cherry tree;
- Stage2: Armillaria is present in advanced form;
- Stage3: the cherry tree is killed due to Armillaria.
The annotation process was considered by each one of the underlying modalities (RGB, multispectral and UAV/aerial).