Constellation diagrams for spectrum anomaly detection in optical networks
- Citation Author(s):
- Submitted by:
- Carlos Natalino
- Last updated:
- DOI:
- 10.21227/g9s9-ba02
- Data Format:
- Research Article Link:
- Links:
 1296 views
- Categories:
- Keywords:
Abstract
Instructions:
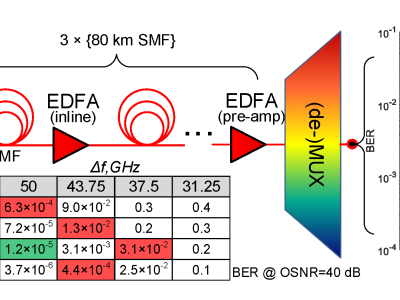
The dataset contains a set of folders, each one representing one normal/anomalous case.
Within each folder, a number of .mat files contain the raw data collected from VPITransmissionMaker. The images folder contains the rendered constellation diagrams.
To render your own constellation diagrams, check the "generate_plots.m" file in the root folder.
More information on how to use in the GitHub repository.


