.tif

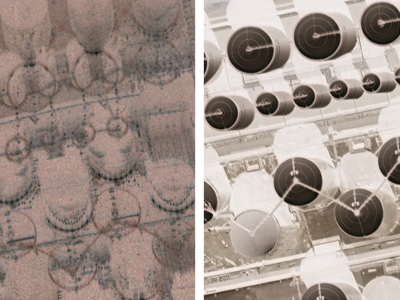
When fuel materials for high-temperature gas-cooled nuclear reactors are quantification tested, significant analysis is required to establish their stability under various proposed accident scenarios, as well as to assess degradation over time. Typically, samples are examined by lab assistants trained to capture micrograph images used to analyze the degradation of a material. Analysis of these micrographs still require manual intervention which is time-consuming and can introduce human-error.

Categories:
266 Views

<p>Images from Sentinel 2 for dehazing. Contains 3 folders, one with original images, one with dehazed images at default exponent of 0.8 and the last with failed images with fine tuned exponent (thus becoming successful).</p>

Categories:
22 Views

Remote imaging systems raise unprecedented challenges in artificial intelligence. The dataset provided (extracted from the SpaceNet 6 challenge) shows SAR images having distorted intensities (compared to the expected results, the latter being visible in the RGB and NIR images which are also provided) due to the geophysics of the SAR acquisition system and the geometries of ground objects. Can we teach an Artificial Intelligence to find the right re-projections for automatically correcting such distorted and compressed intensities ?

Categories:
230 Views

This data set is regarding the paper submitted to the IEEE Transactions on Molecular, Biological, and Multi-Scale Communications. The title of the paper is 'Molecular Signal Tracking and Detection Methods in Fluid Dynamic Channels' with the ID of TMBMC-TPS-19-0014.R2. The data are images taken from the particle image velocimetry (PIV) method and the Planar Laser-Induced fluorescence (PLIF) method. The images are being used to describe these two experimental methods for the molecular communication community.

Categories:
193 Views

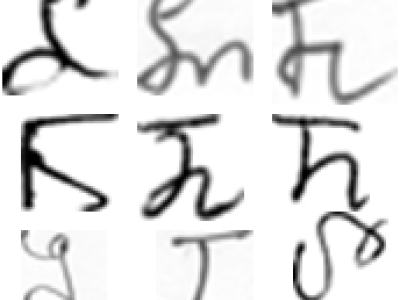
The dataset consists of 60285 character image files which has been randomly divided into 54239 (90%) images as training set 6046 (10%) images as test set. The collection of data samples was carried out in two phases. The first phase consists of distributing a tabular form and asking people to write the characters five times each. Filled-in forms were collected from around 200 different individuals in the age group 12-23 years. The second phase was the collection of handwritten sheets such as answer sheets and classroom notes from students in the same age group.

Categories:
667 Views